

90POE · Design Manager/PM · Product transformation
From paper and pencils to a digital platform. I owned it from research to launch.
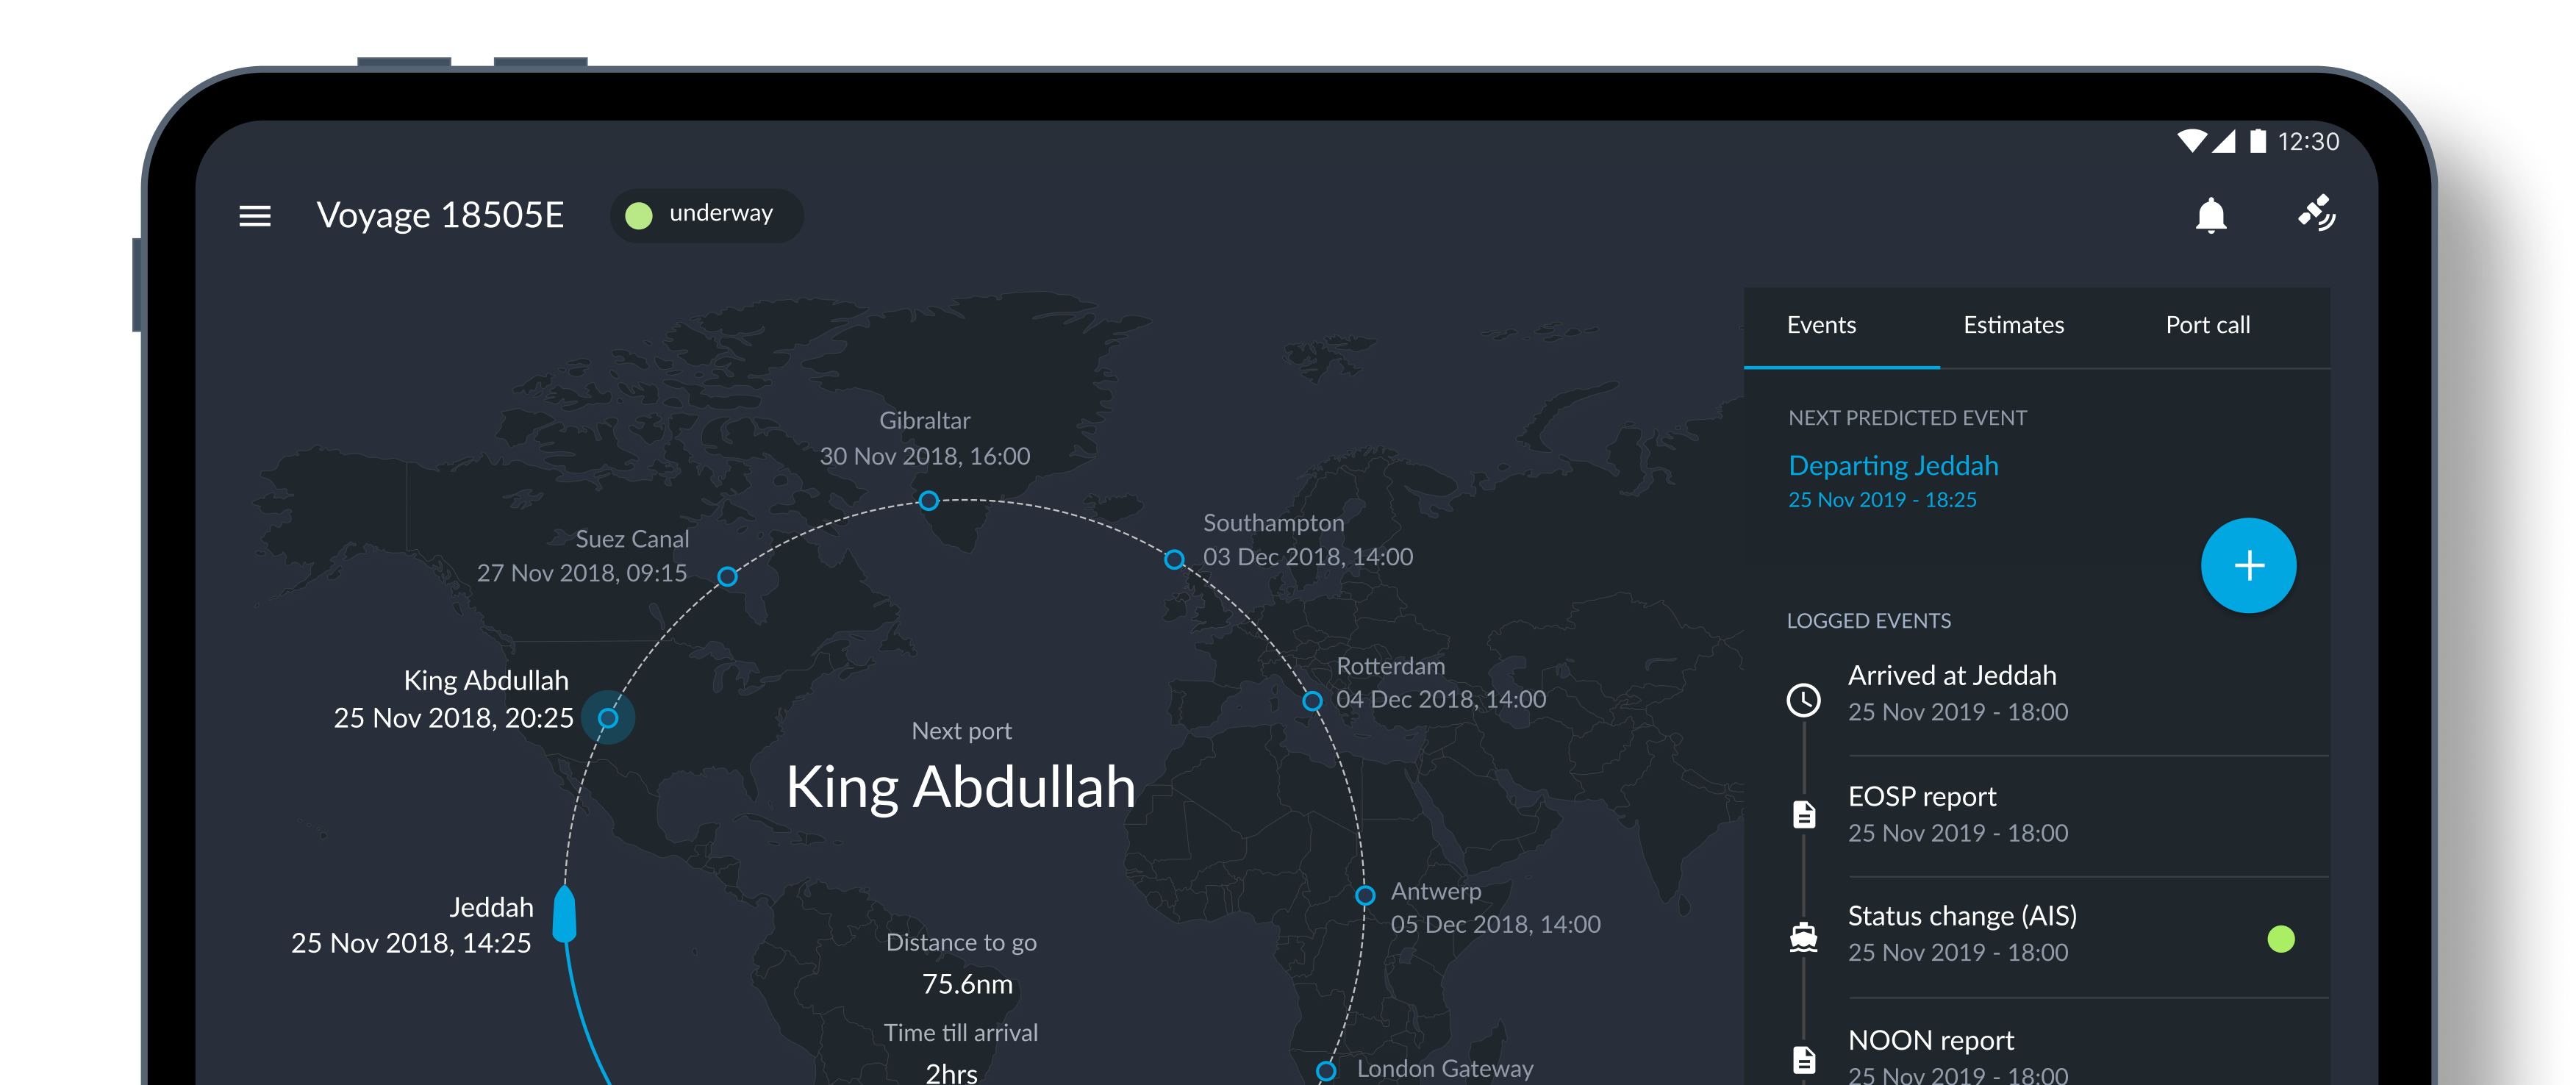
Results
4 mins
Typical noon reporting,down from 2.5 hours
10
Vessels deployedinto live operations
37
Onboard workflowsdigitised
1000+
Operational data points madeavailable to shore in real time
The problem
The vessel generated the data.
The business could barely see it.
Every voyage produced critical information about position, fuel, maintenance, crew, safety and port activity.
Most remained trapped onboard in paper logs, spreadsheets and ageing systems. Operations, Technical, Crewing and Safety teams on land received only fragments once or twice a day, leaving them to make decisions from an incomplete and outdated picture.
The objective was not to digitise everything. It was to identify which data and workflows would create the greatest value, then capture that information once and make it useful across vessel and shore.
The research
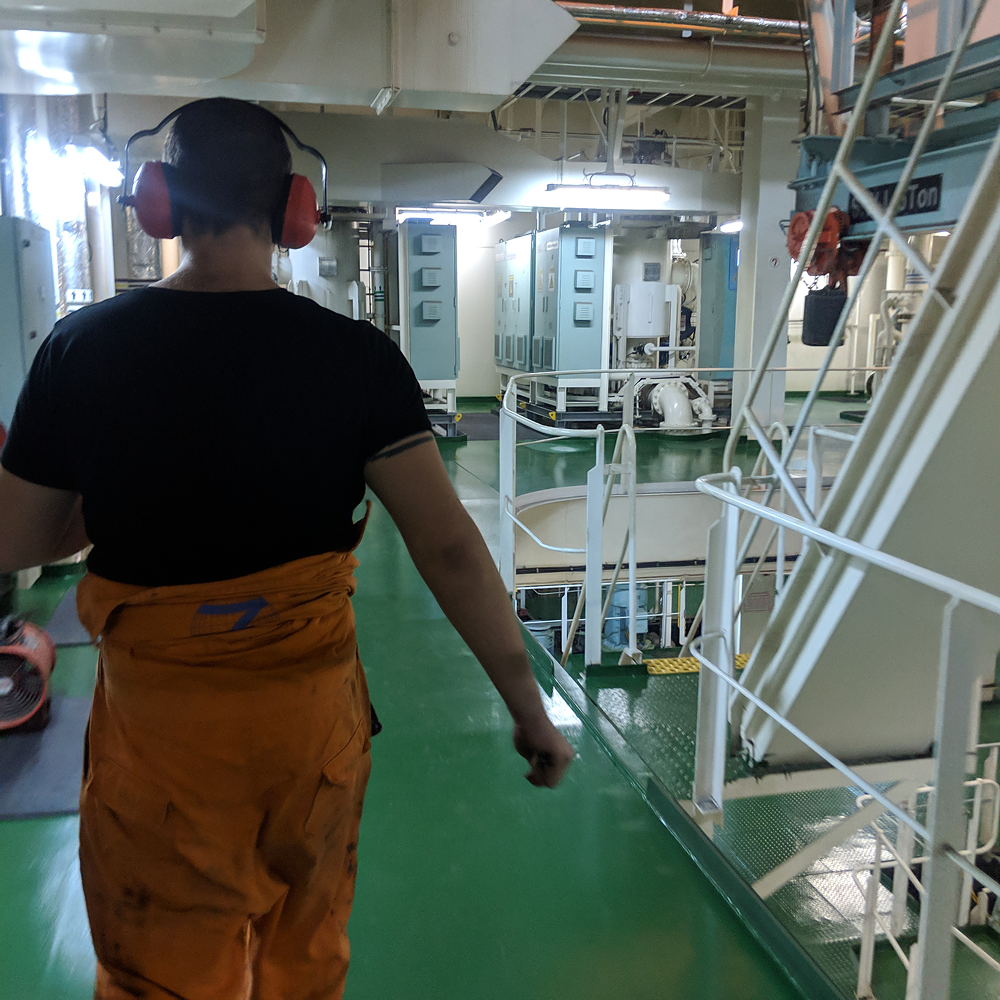
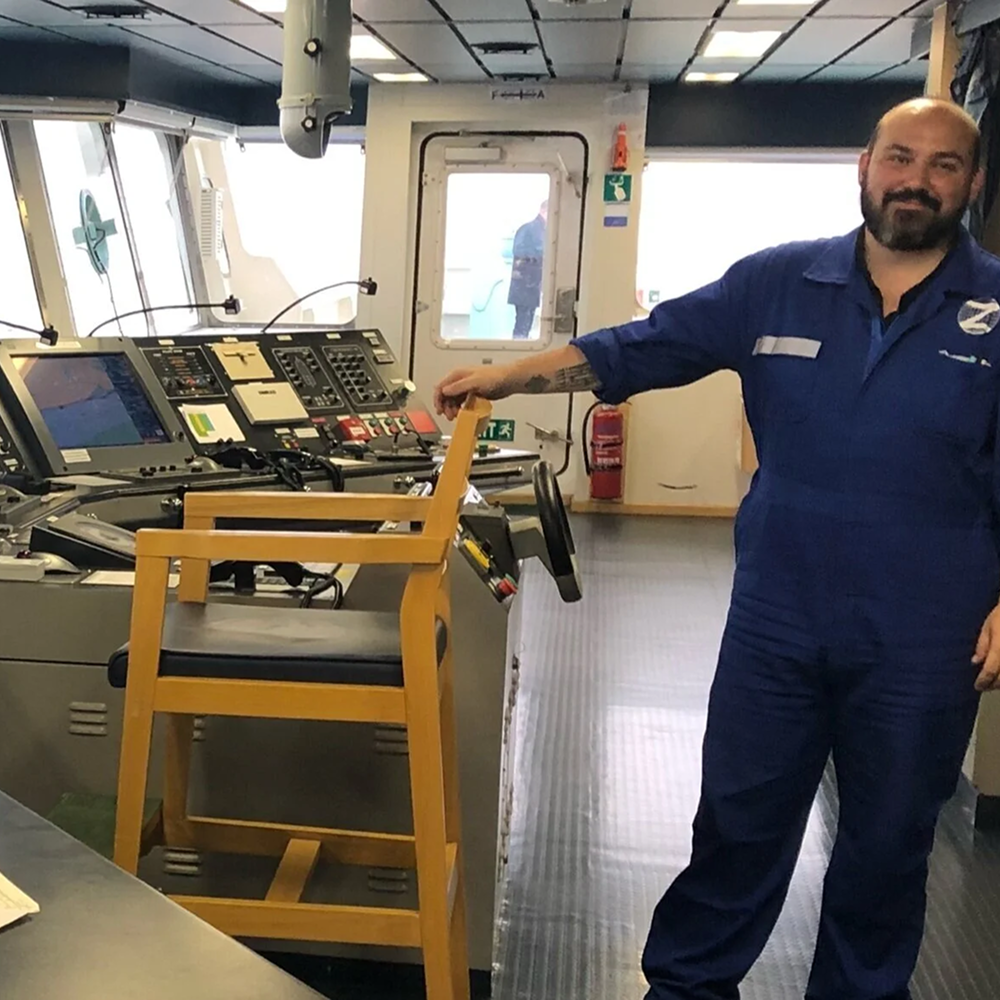
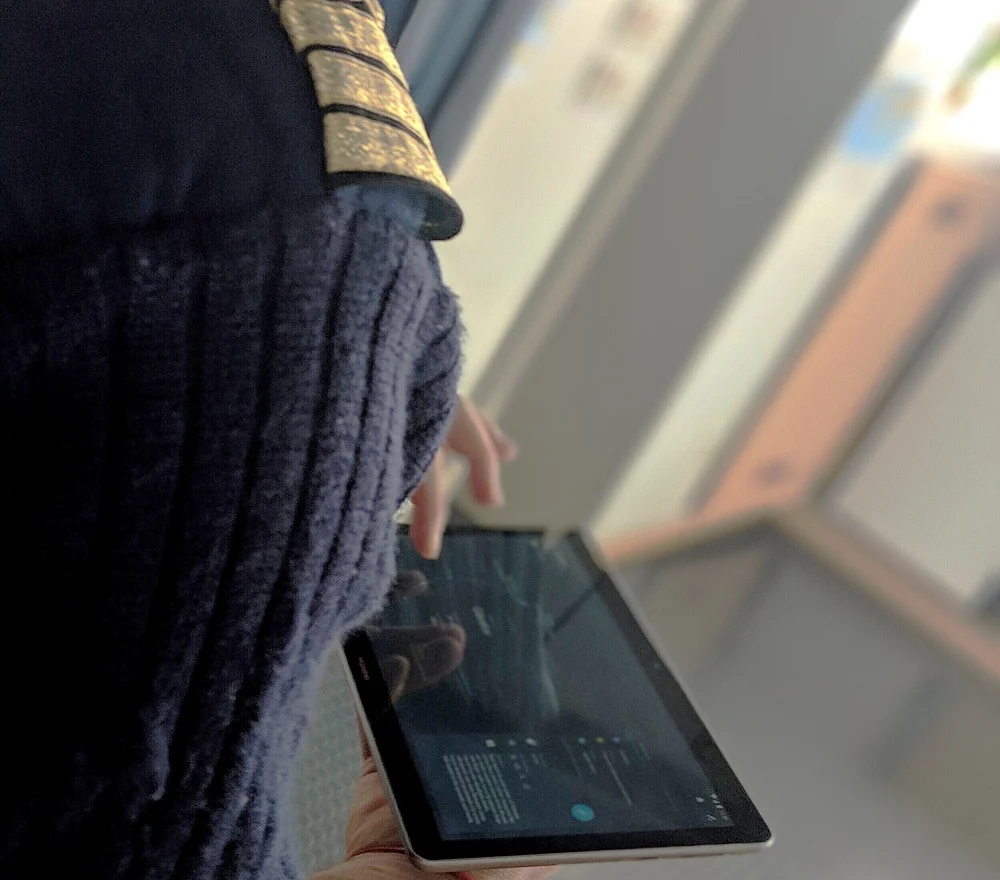
I spent 500 hours onboard until the crew were building the product with me.
I worked alongside captains, officers and engineers across live voyages, observing not only individual tasks but how people, information and decisions depended on one another.
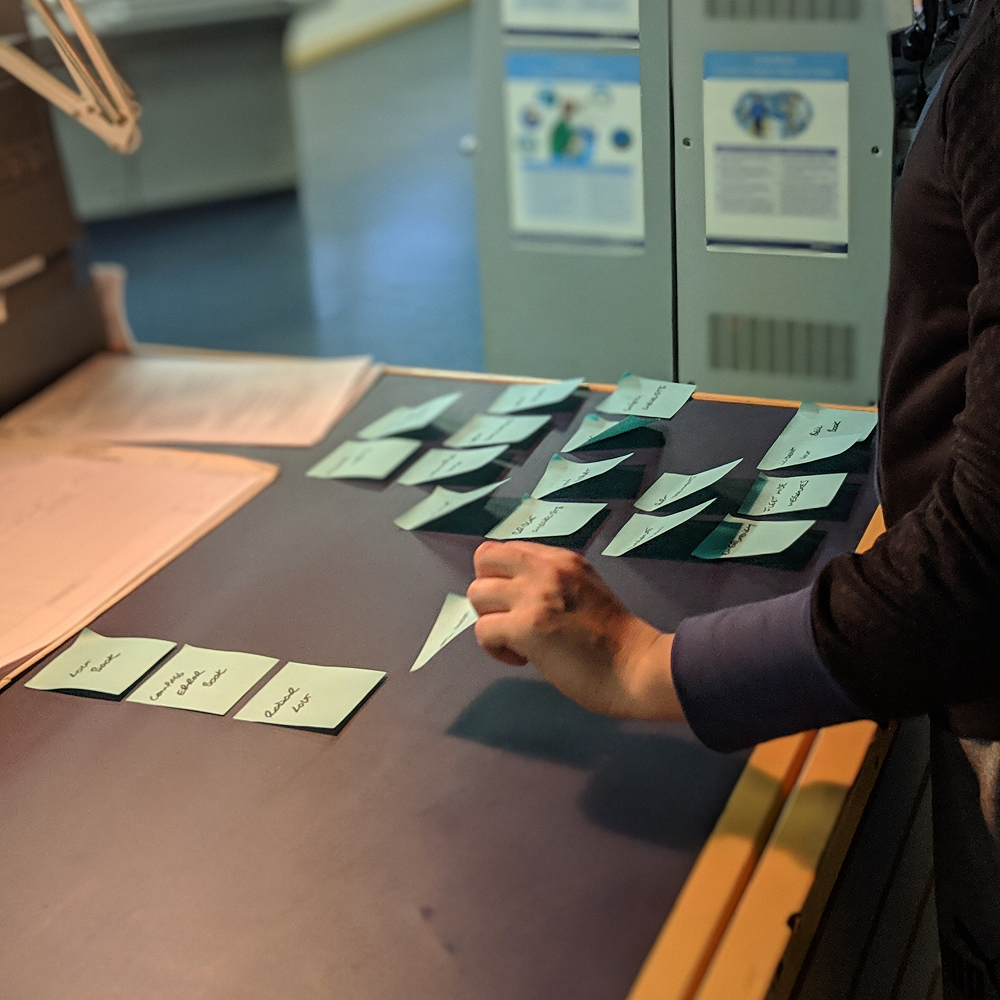
We mapped journeys, ran workshops, tested concepts and co-created working prototypes onboard. Some ideas moved from a conversation on the bridge to tested software on the same day.
500+
Hours onboard1,000+
Photographs77
Tasks observed27
Seafarers interviewed100+
Existing tools mapped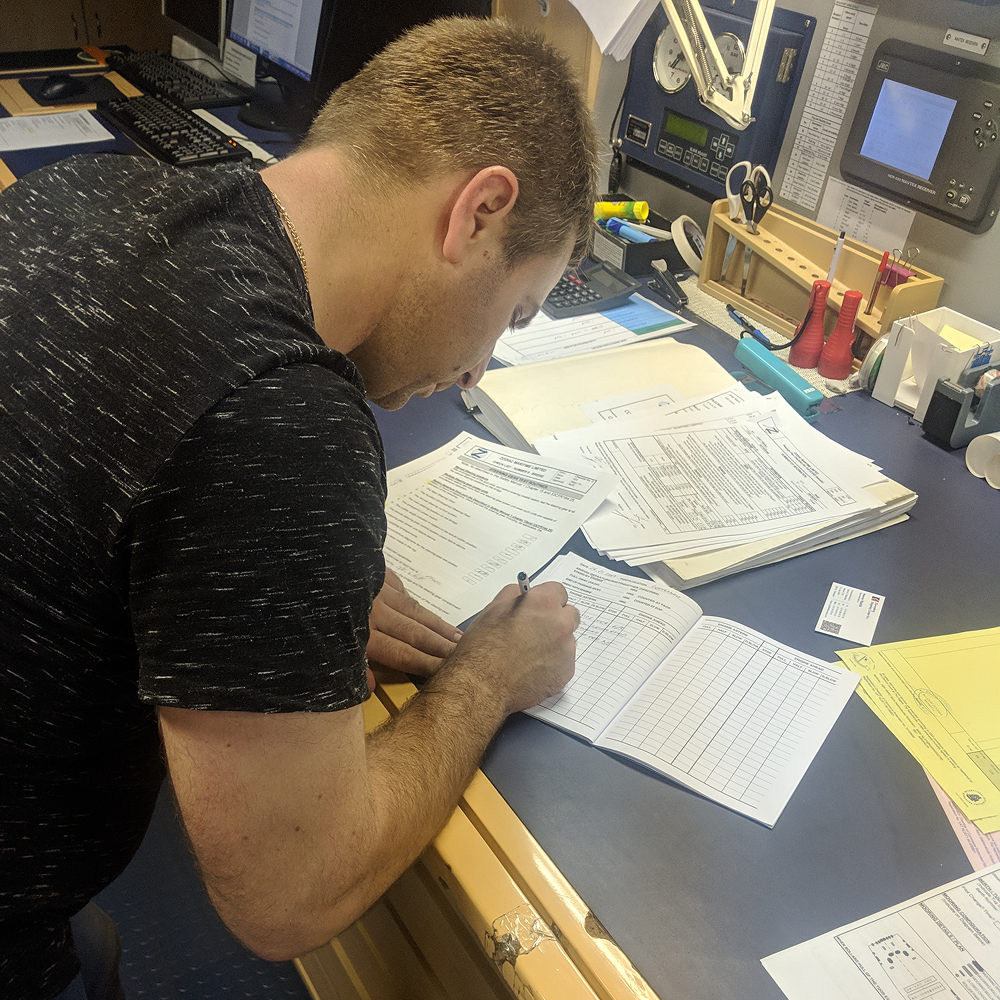
The unlock
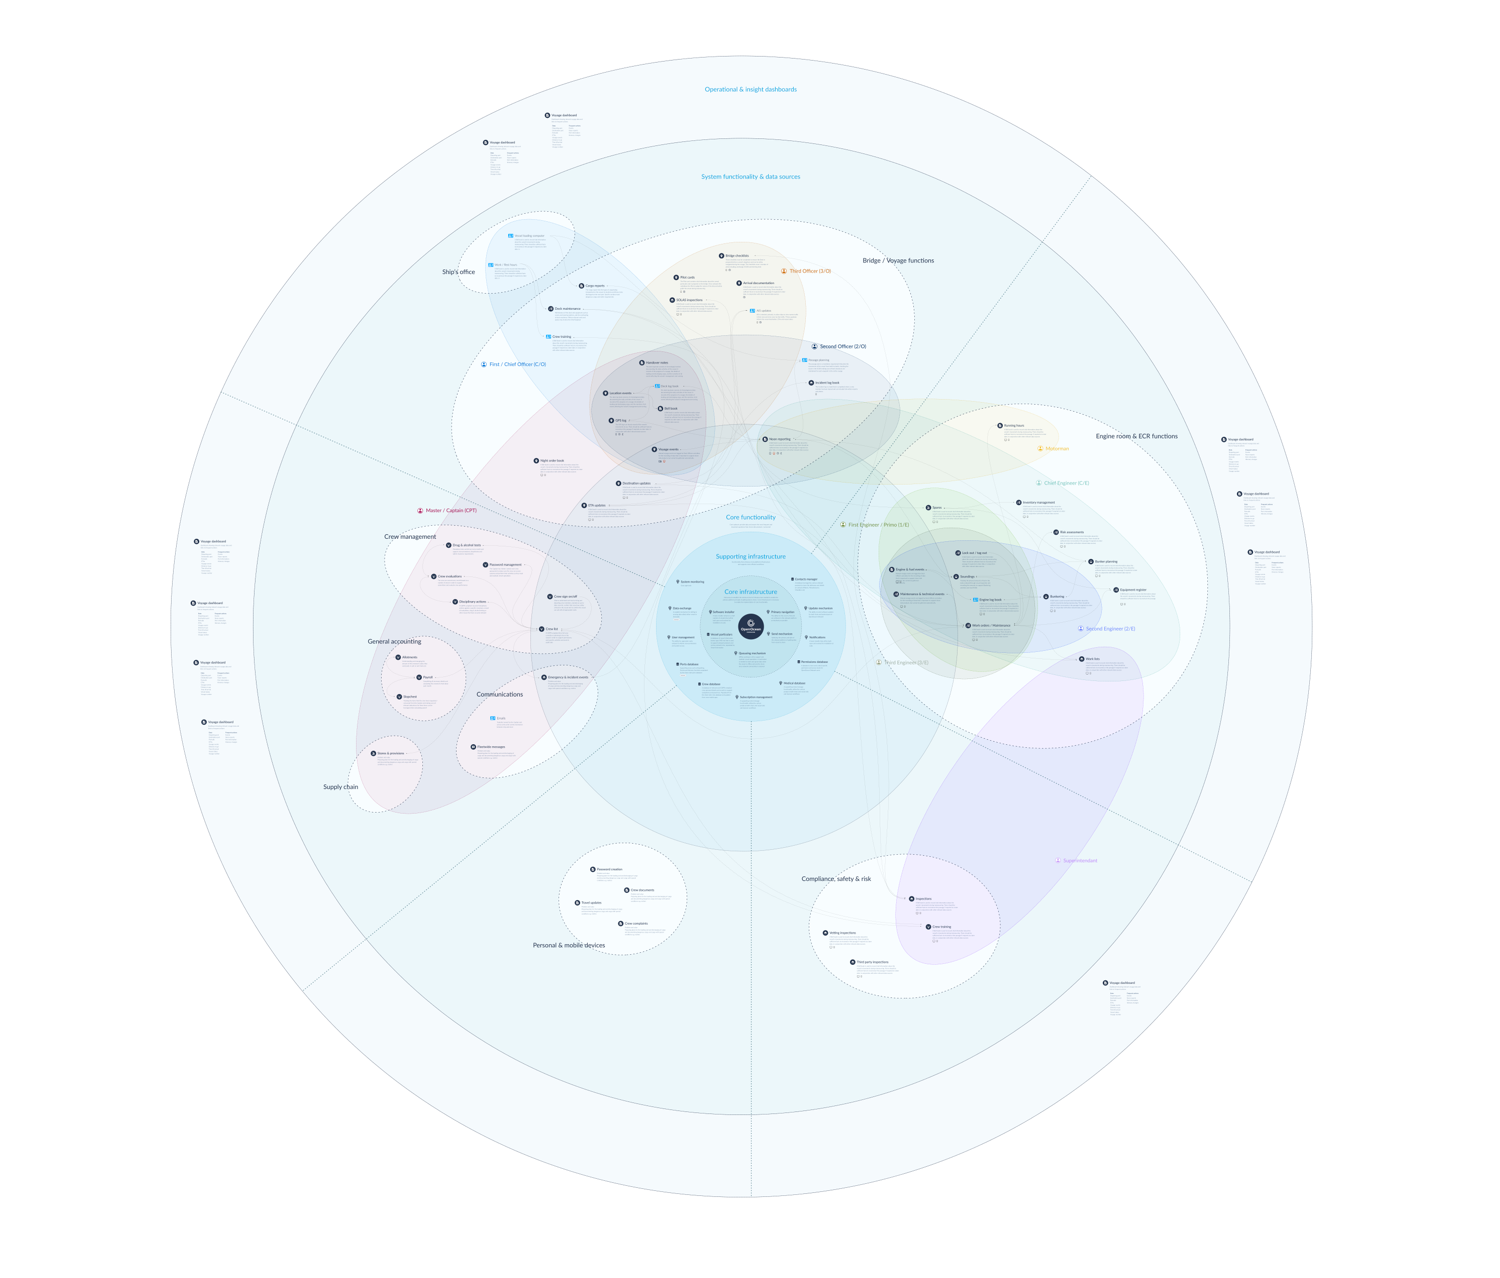
I mapped the vessel as one connected system for the first time.
Over several months, I created a new model connecting every crew role, task, report, data point, system and dependency across the vessel, including work we had no plans to digitise.
It revealed where information originated, where it was repeated, who depended on it and how many other workflows could benefit once it was captured correctly.
The map explained the system. Card sorting with the crew explained how it should work.
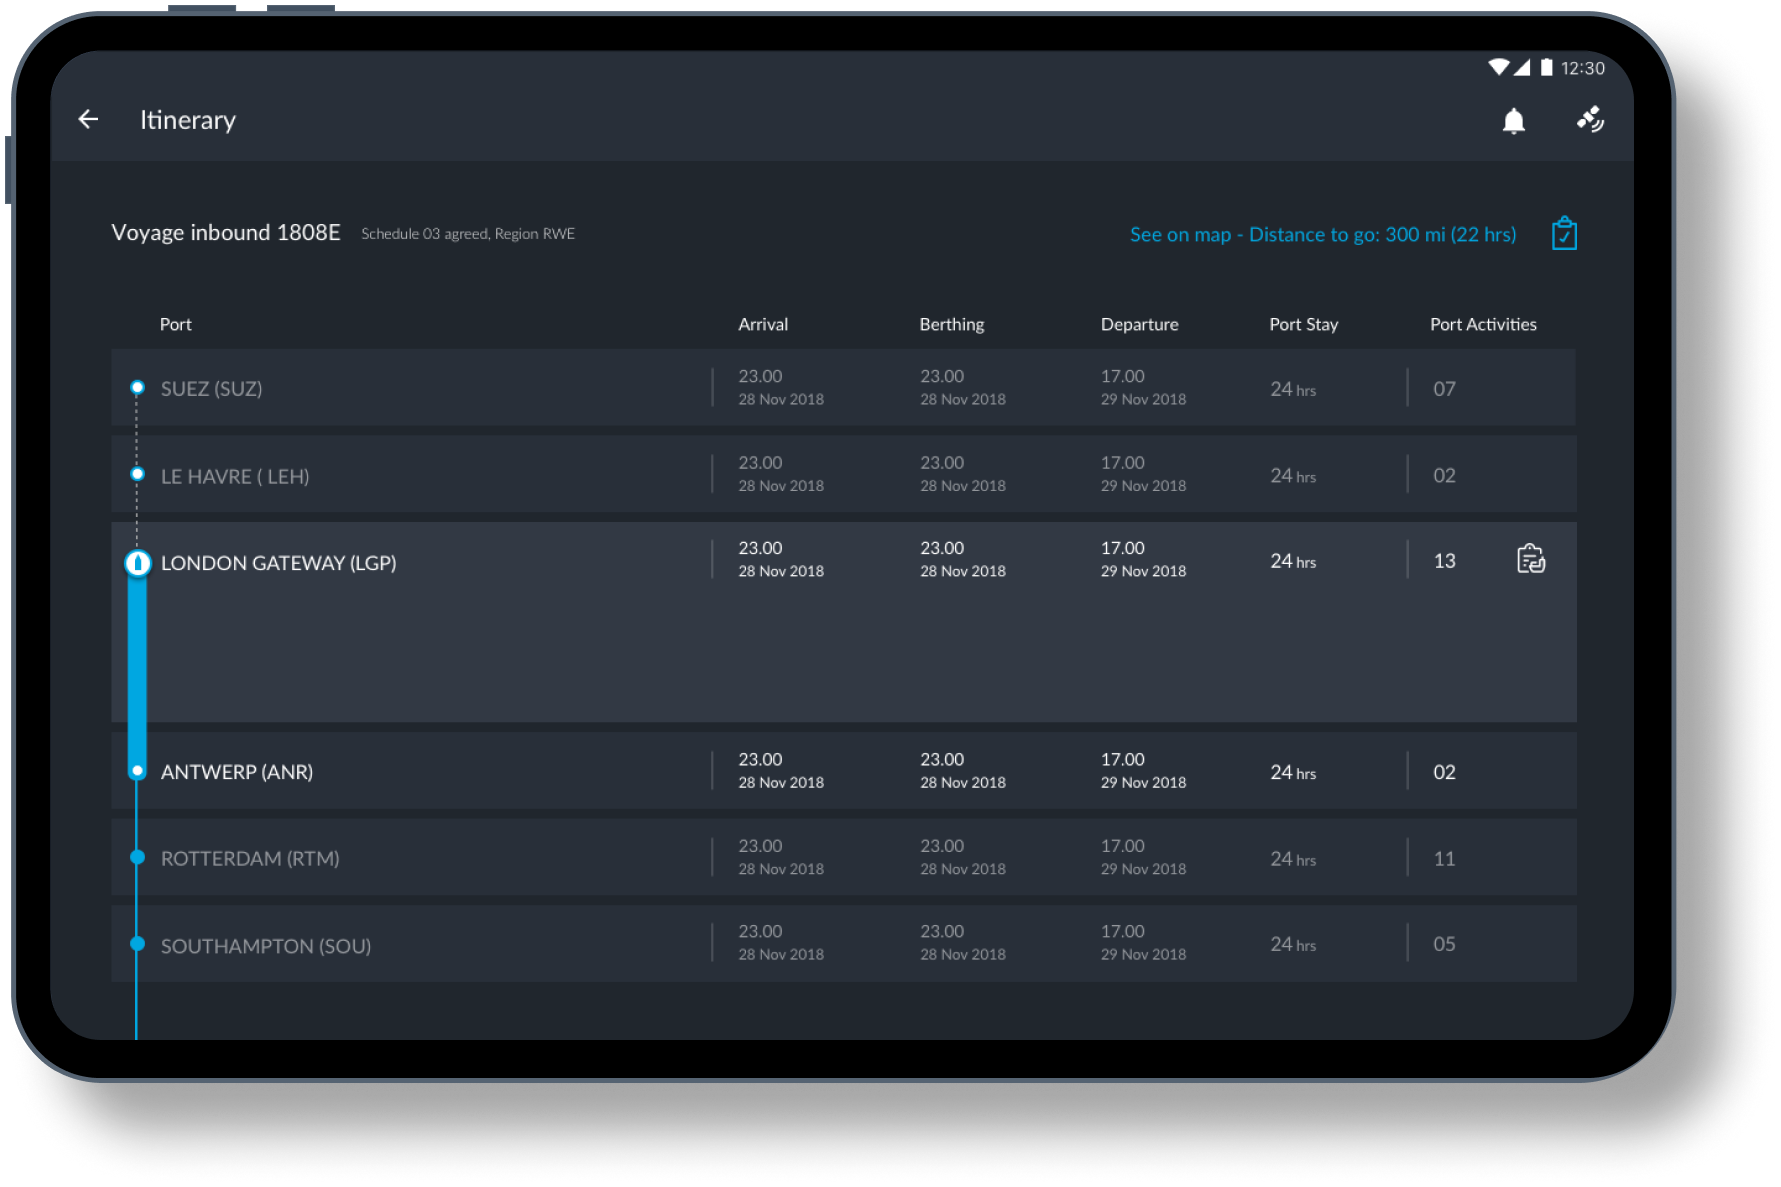
They organised their work around the voyage, not departments or software categories. The itinerary became the interface, surfacing the relevant reports, tasks and actions for each stage, with every workflow no more than two levels deep.
The map defined the platform. The voyage defined the experience.
The transformation
I turned the research into a roadmap the organisation could fund and deliver.
The platform crossed vessel operations, shore-side products, hardware and infrastructure. Every team had different priorities, dependencies and ideas about what should come first.
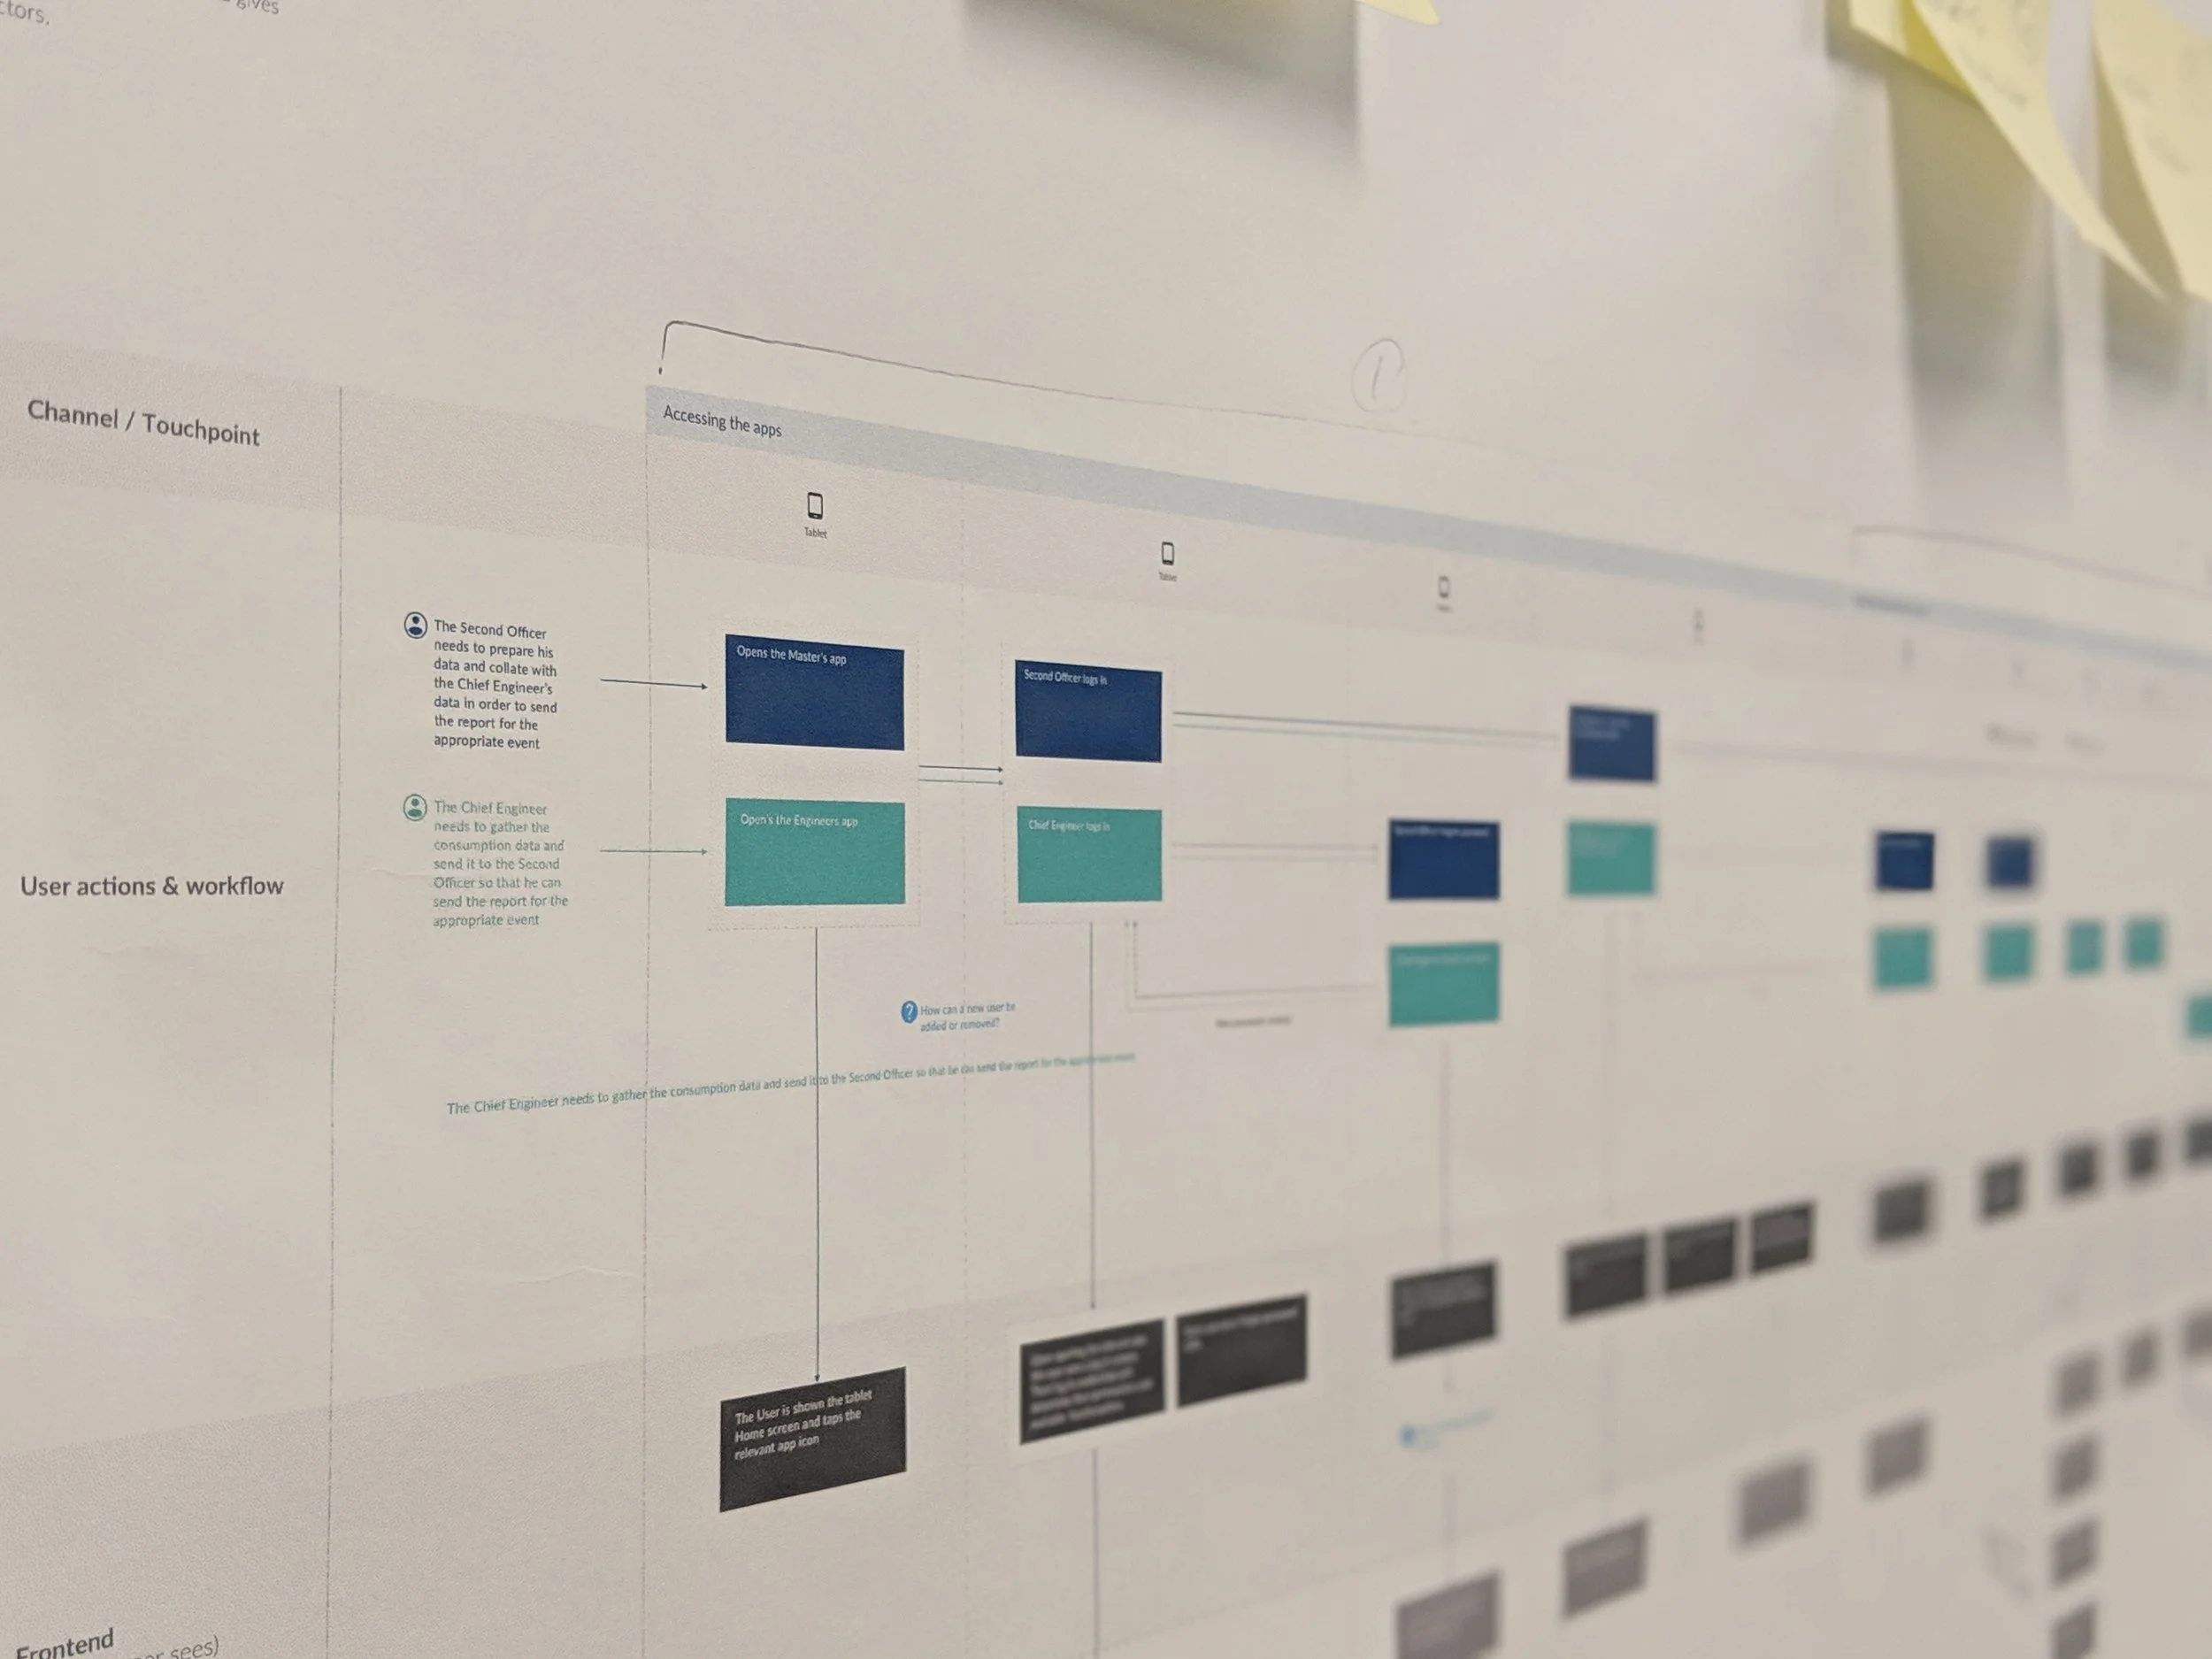
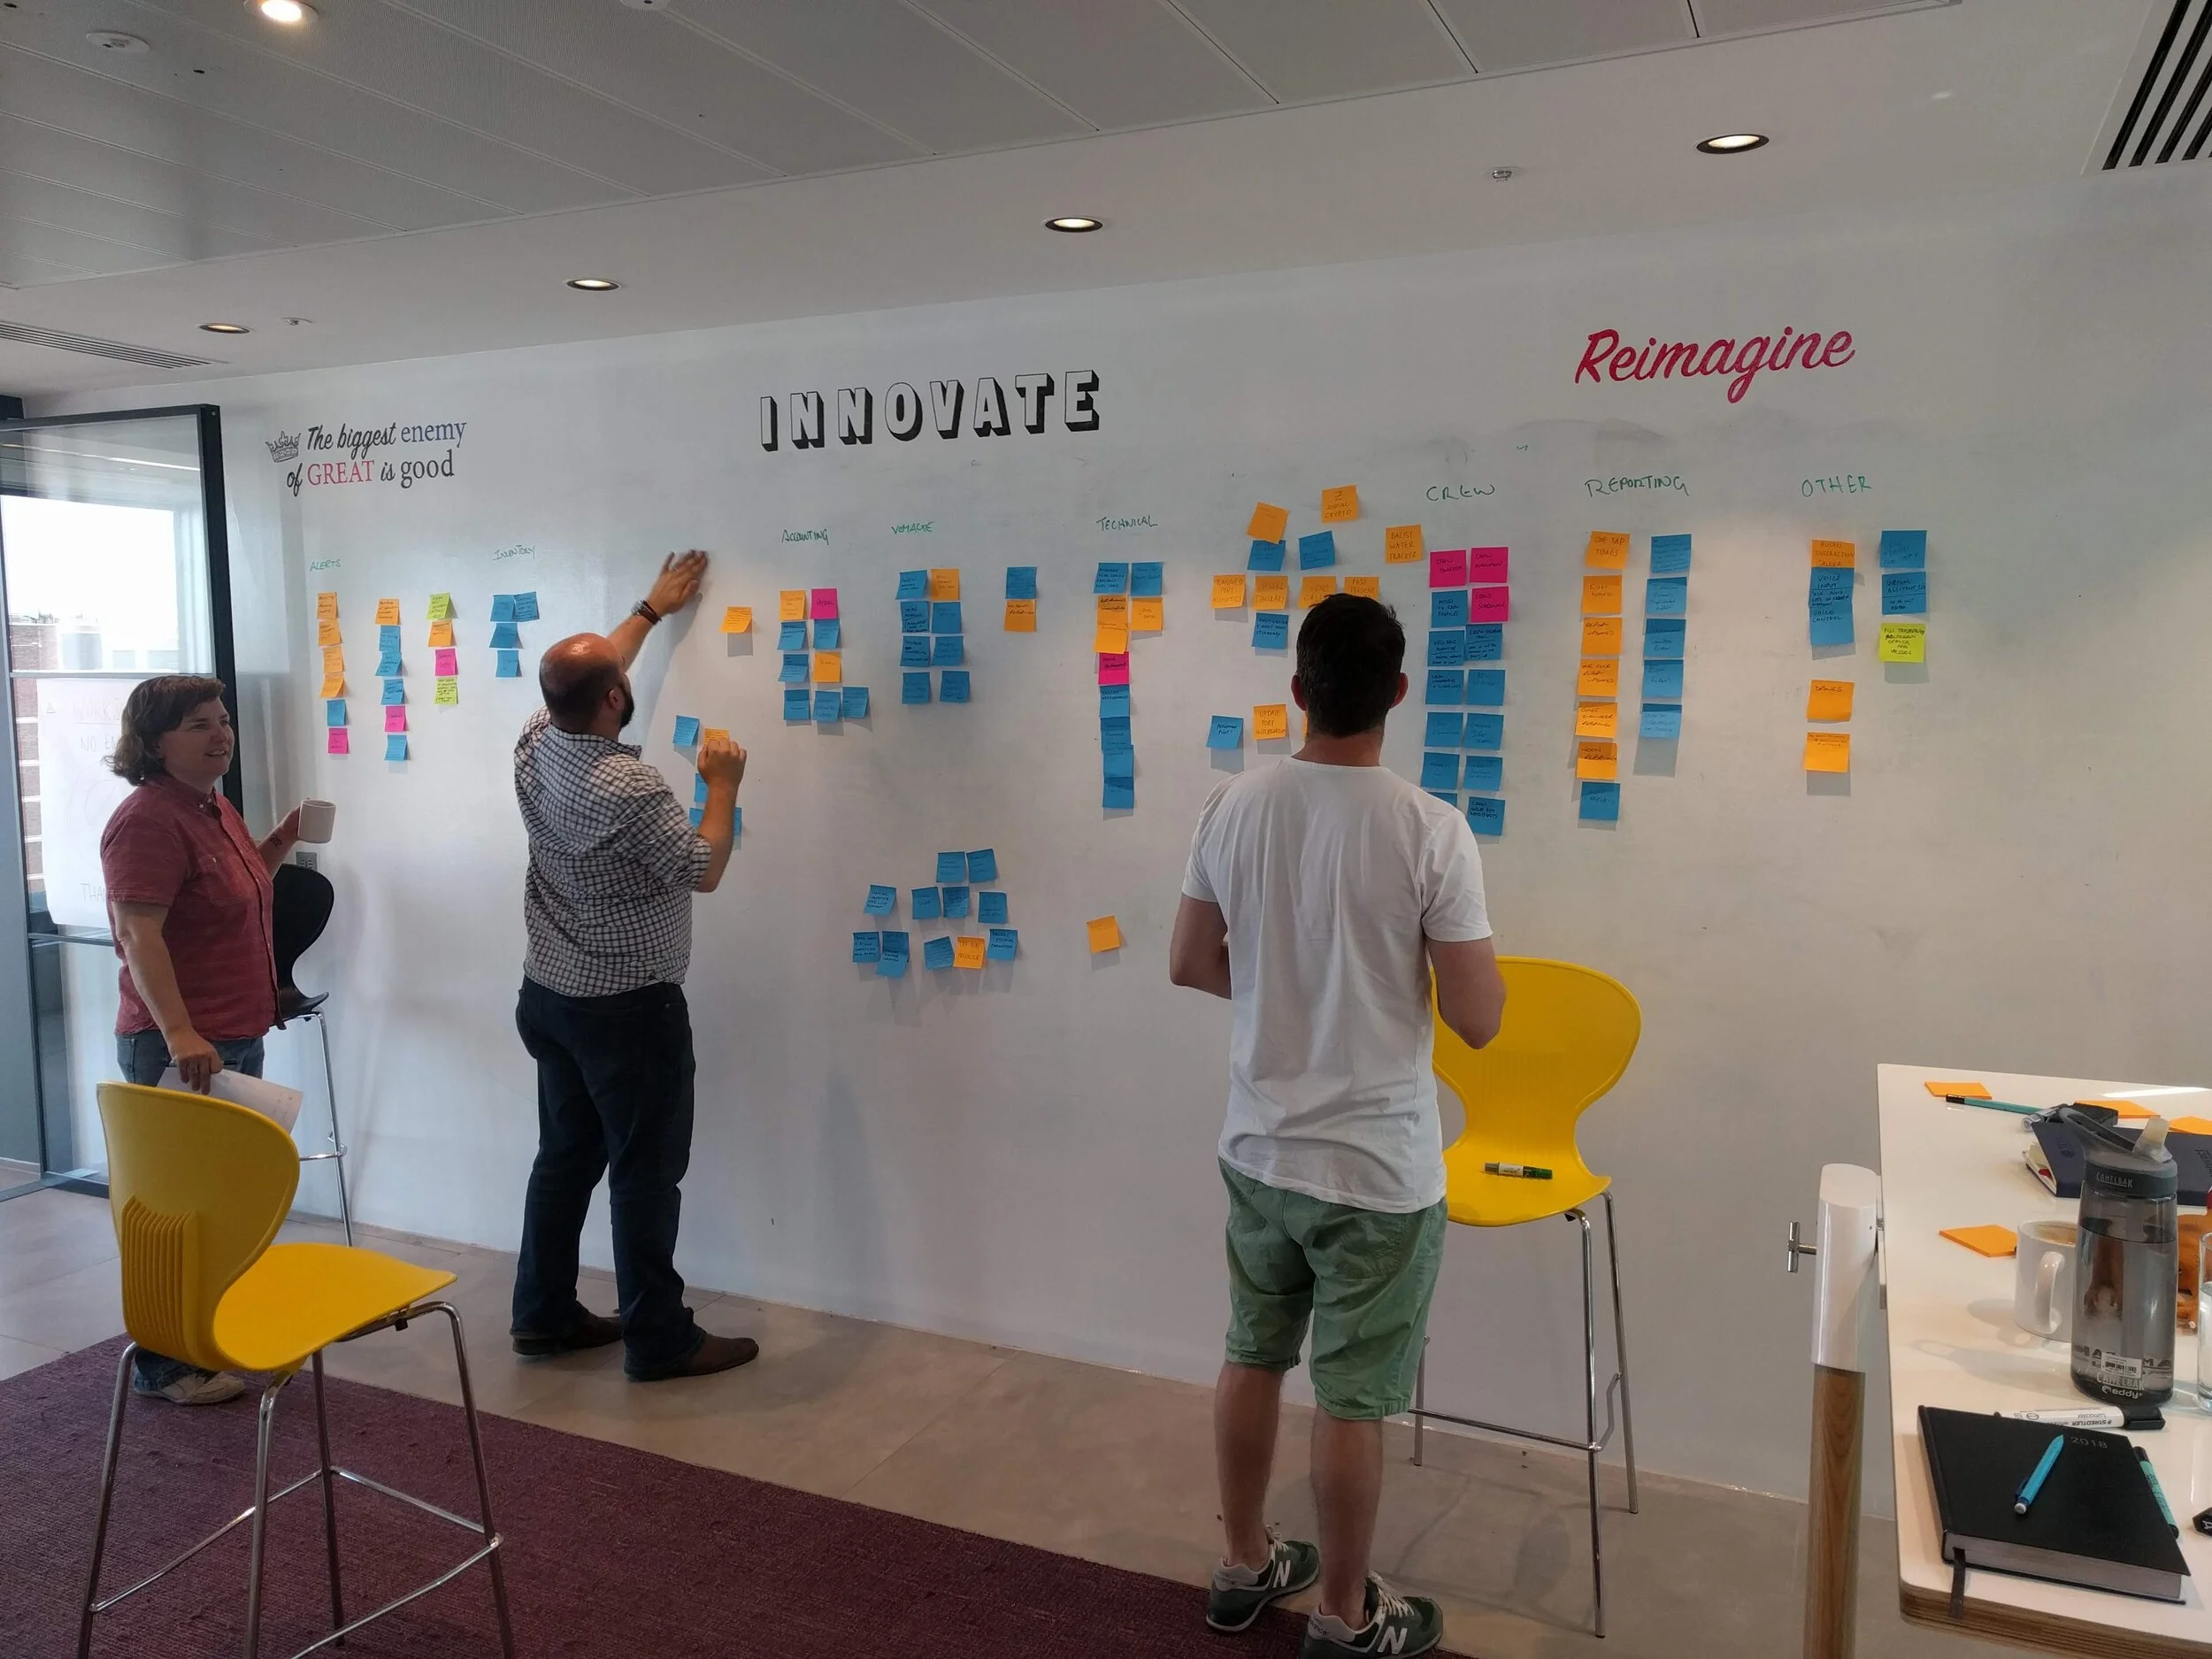
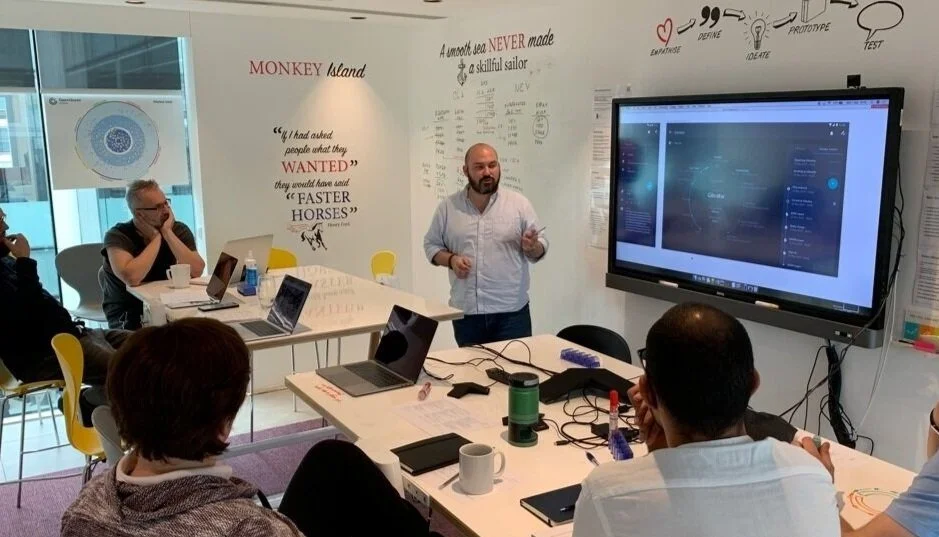
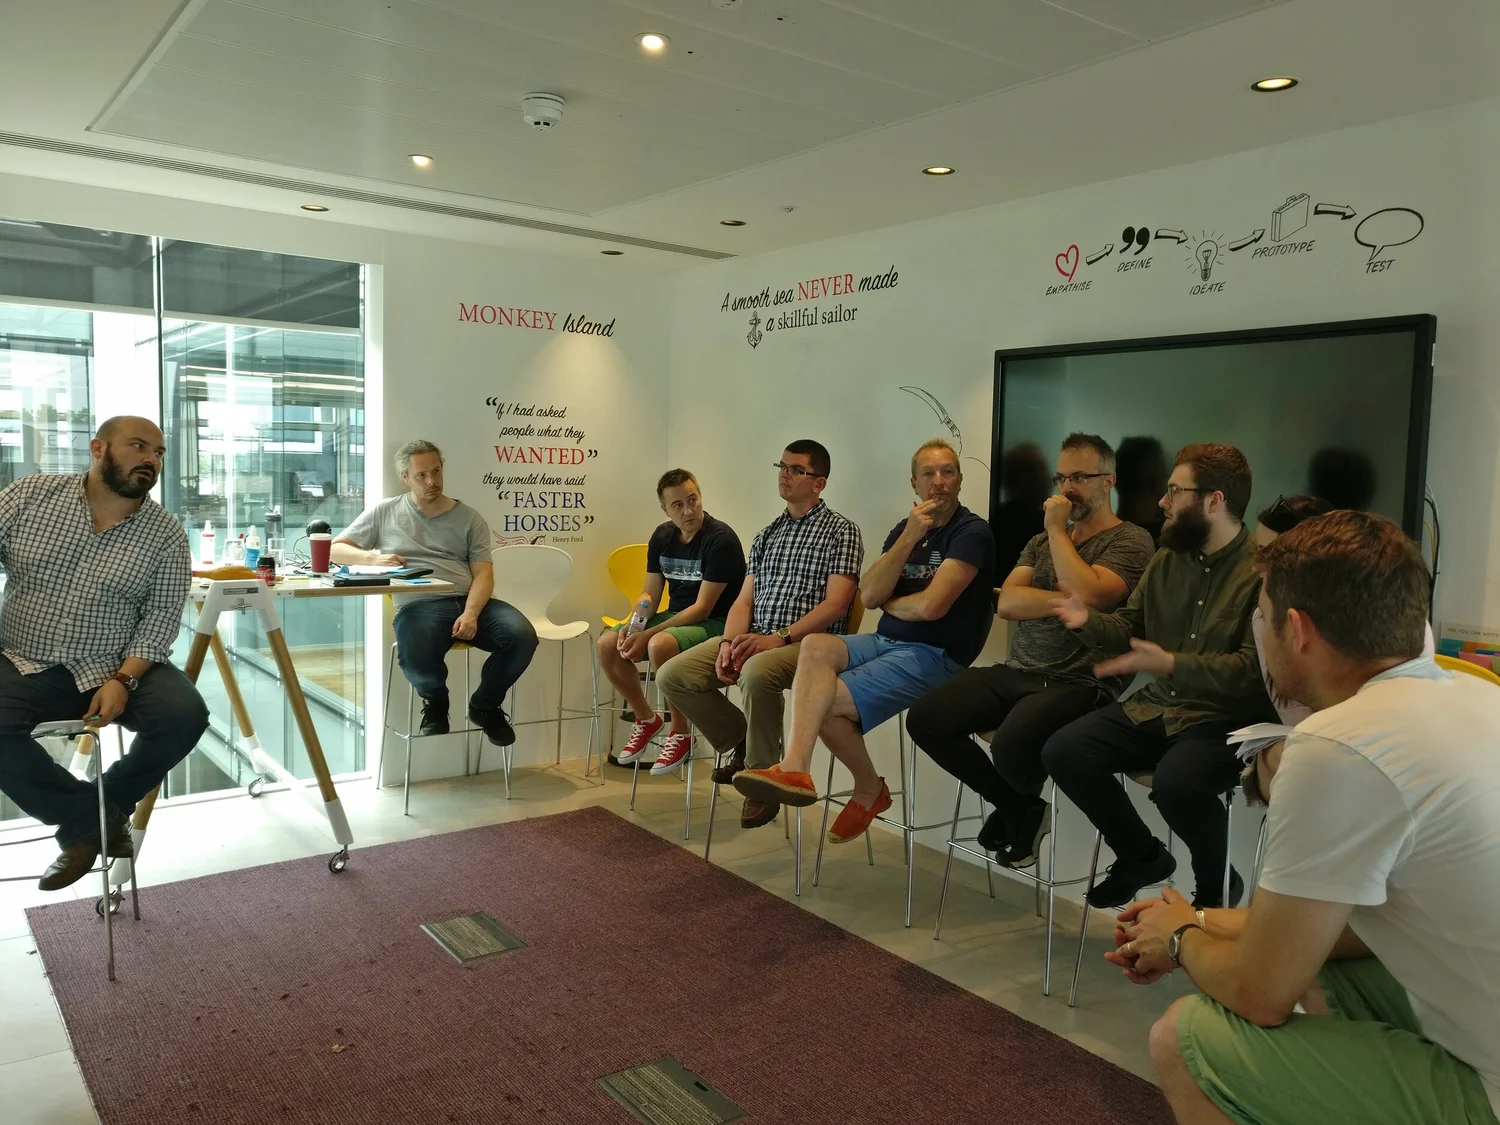
I used workshops, service blueprints, prototypes and live customer testing to align leadership, Product and Engineering around a phased roadmap. I matched onboard delivery to the capabilities required by shore-side products, while defending the crew experience through political, technical and commercial trade-offs.
Starting with Noon reporting, I made an unfamiliar platform tangible to crews, stakeholders and shipping companies before most of it existed.
The proof, then the platform
I built the platform through constant testing onboard.
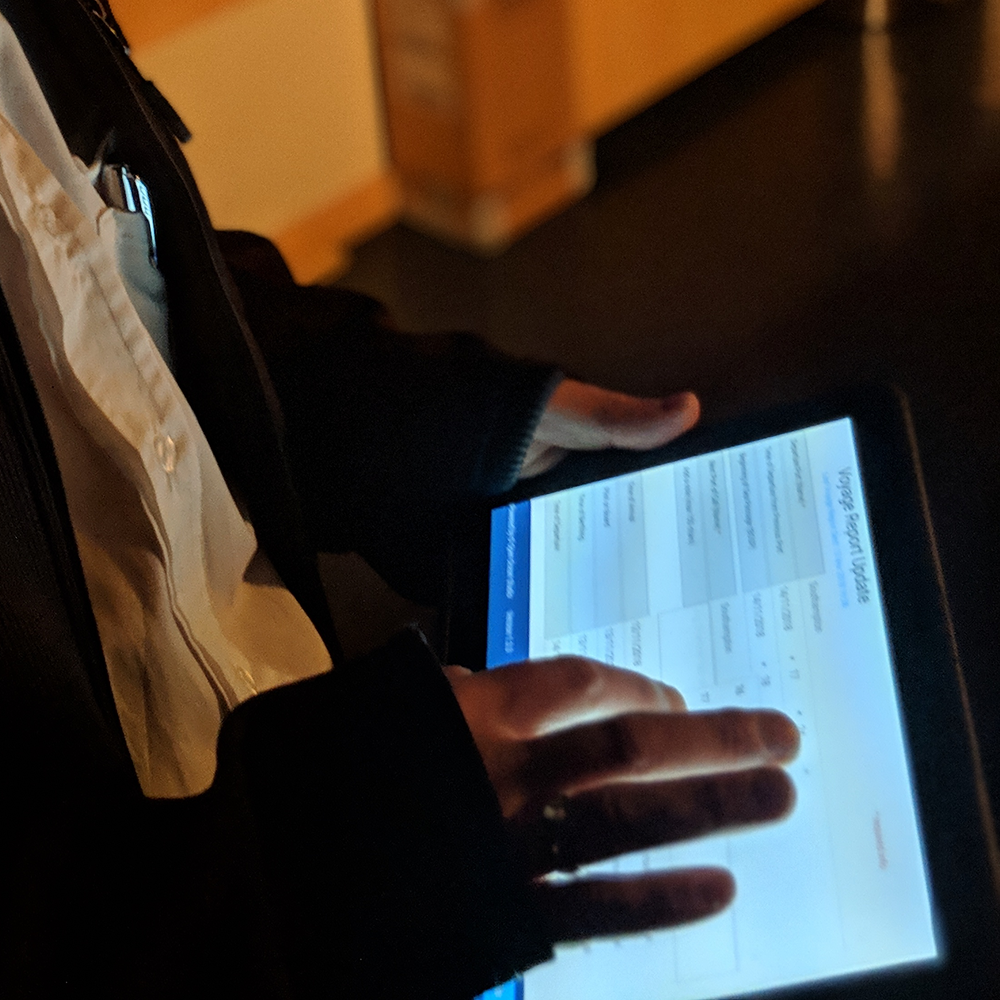
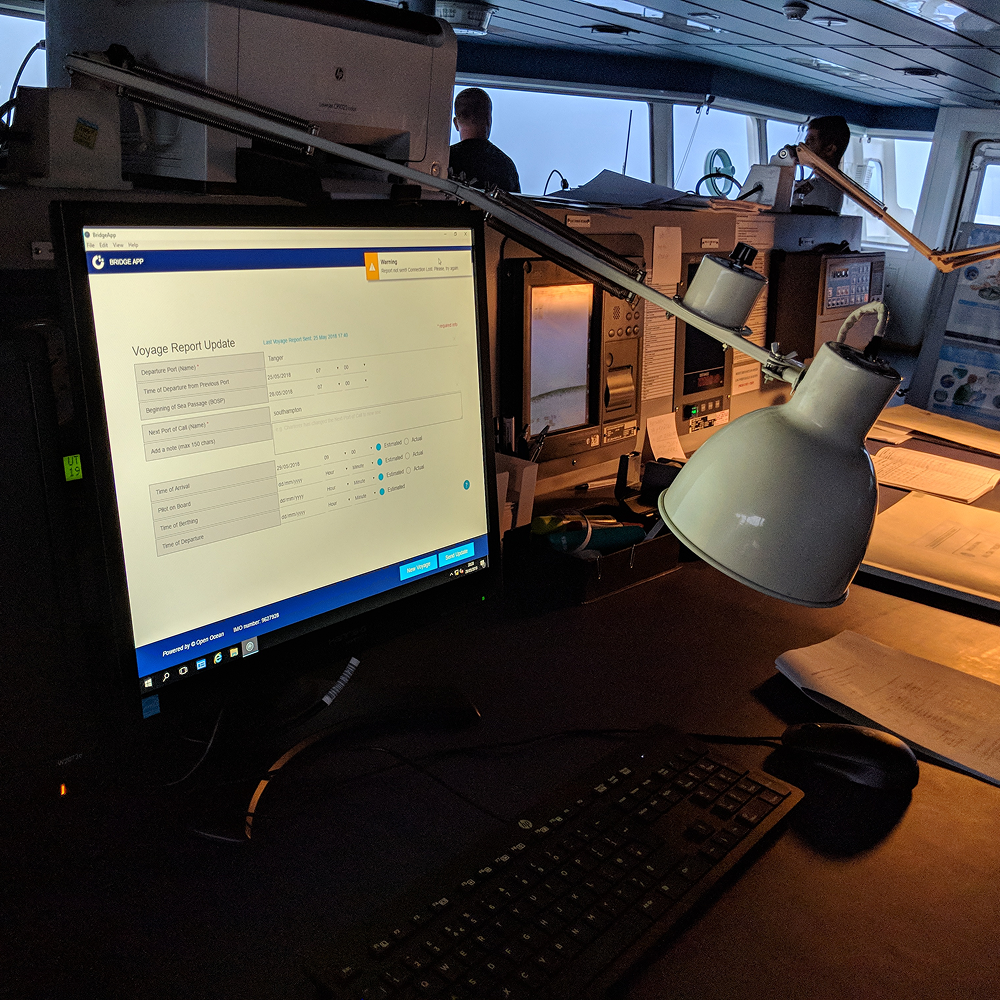
The build was iterative. Early proofs of concept were simple screens, tested onboard almost as soon as they existed, then rebuilt as we learned what the crew actually needed.
Noon reporting started that way. It was mandatory, universal and highly dependent on information from across the vessel, so it began as a basic form tested live on the bridge, then grew more sophisticated: integrated with onboard sensors and systems, and extended from a single desktop terminal to tablet and mobile.
The result
Noon reporting fell from 2.5 hours to four minutes.
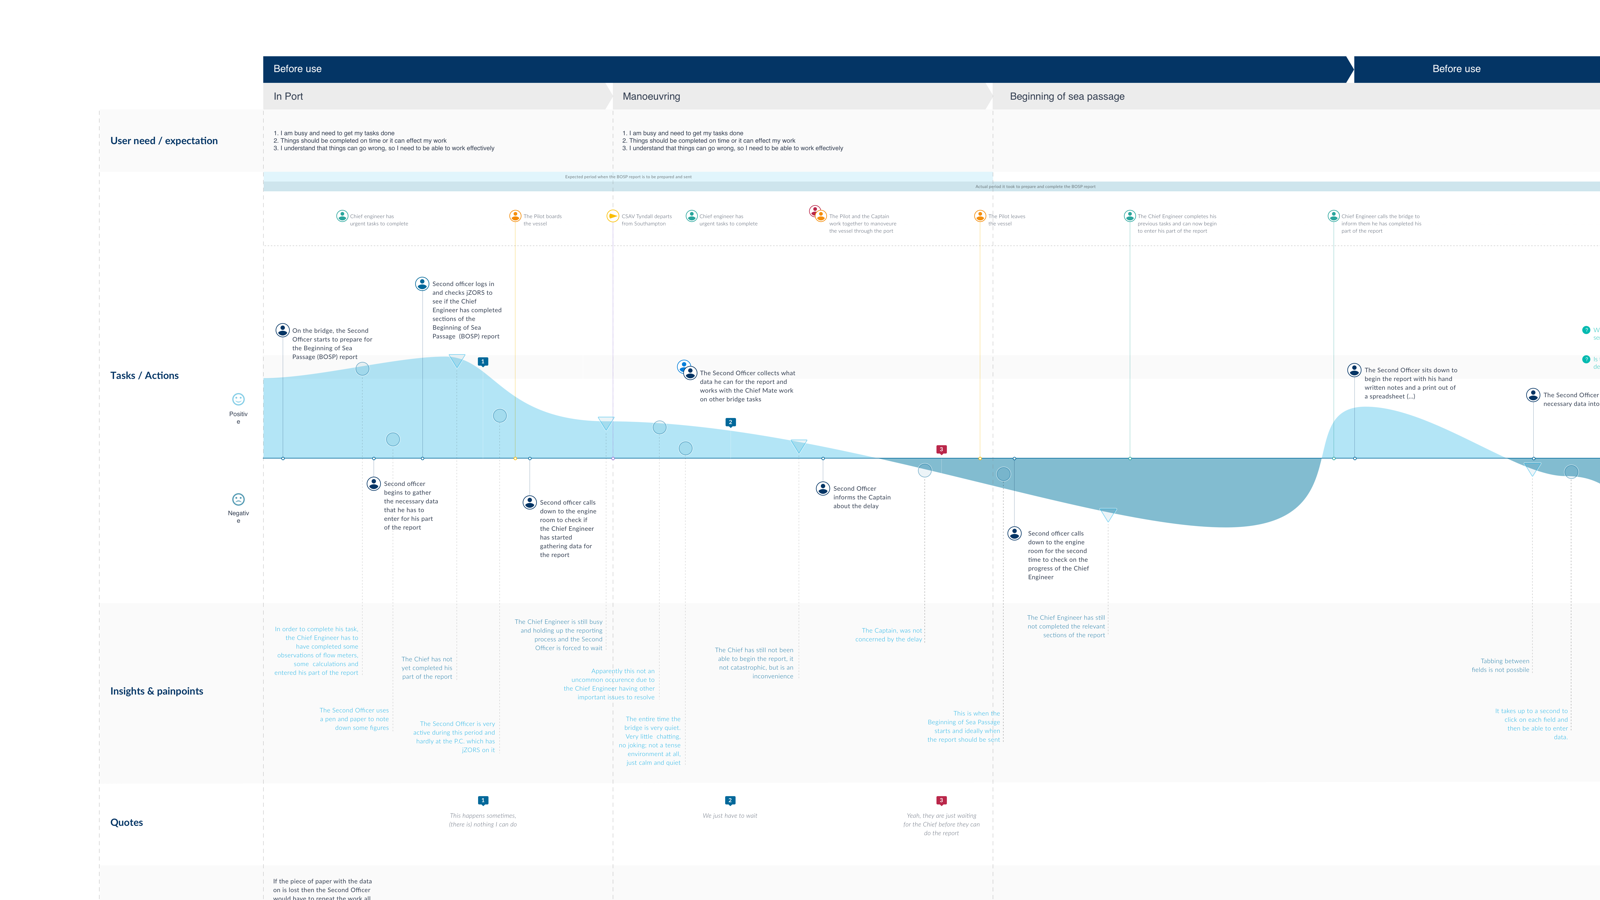
The Second Officer assembled up to fifteen pieces of paper, waited for readings from the Chief Engineer and other crew, then applied calculations and copied the results into spreadsheets, emails and logs. A typical report took 2.5 hours. I once watched the process take 15 hours when urgent work interrupted the chain.
We didn't just move that process onto a screen. OpenOcean prepared the next report in advance using the vessel itinerary, onboard systems and digital input from Engineering, so more than 90% was already complete when opened, with calculations applied, missing data flagged and the crew retaining final approval. Noon reporting became a digital, predictive experience, not a faster version of the paper one.
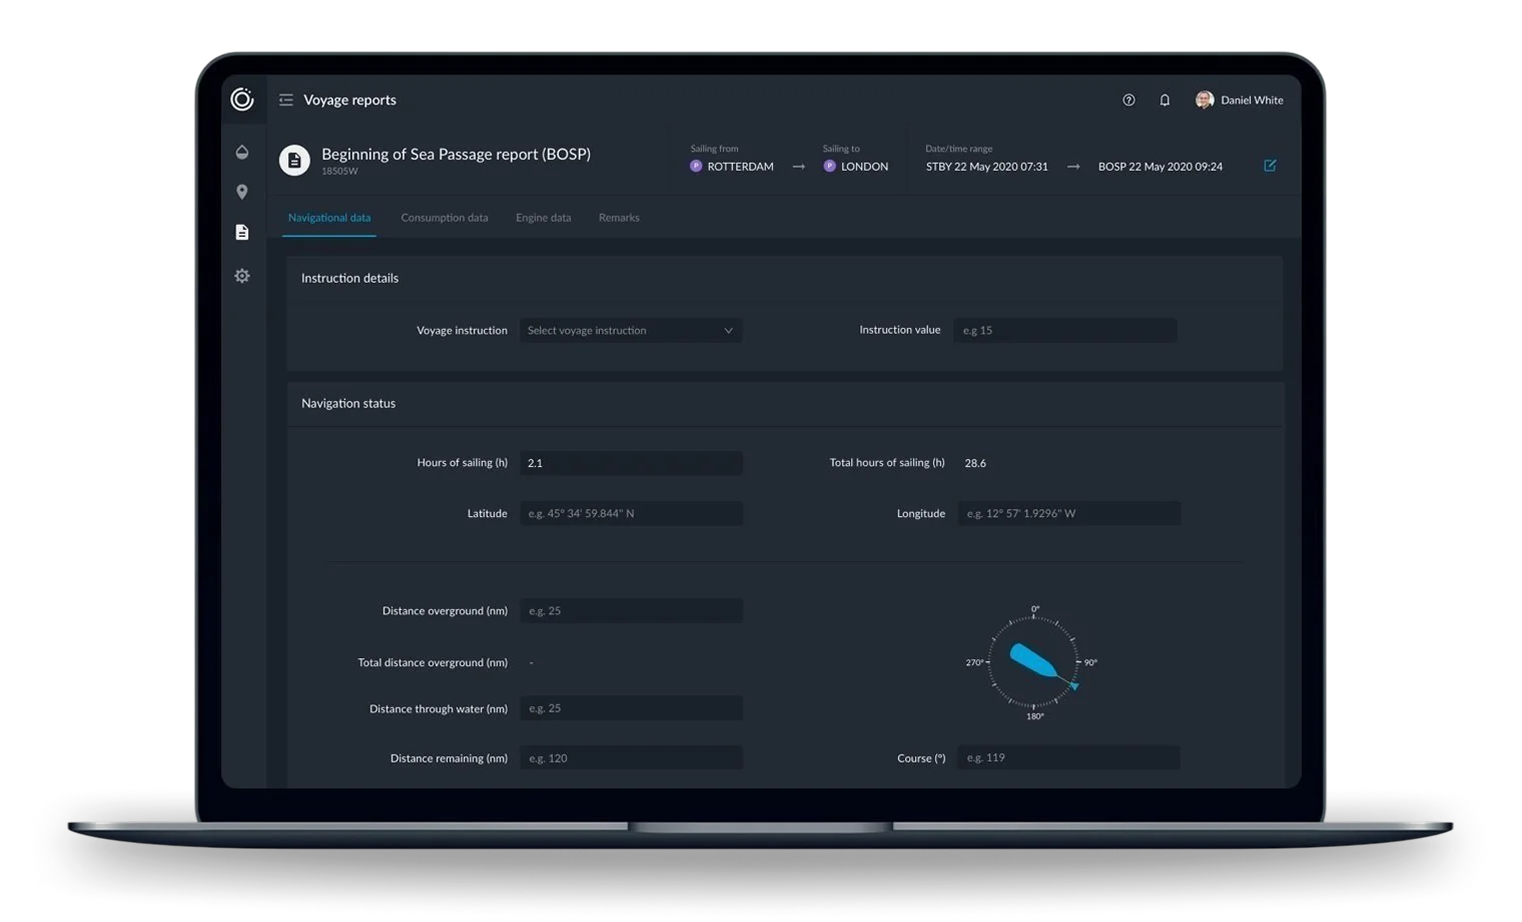
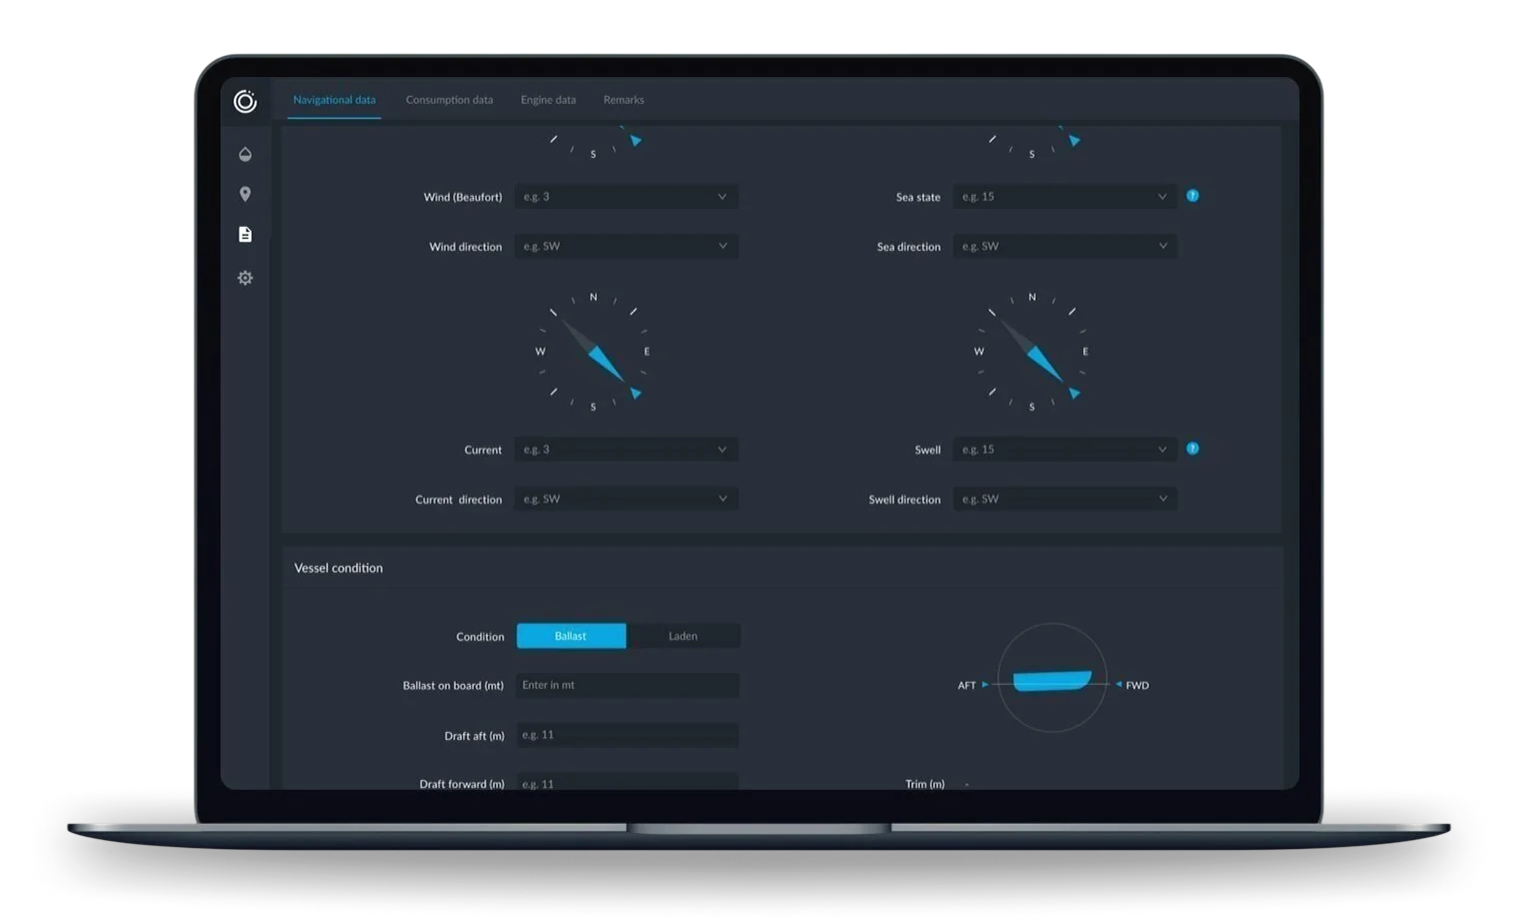
Noon reporting was one workflow. We built 37.
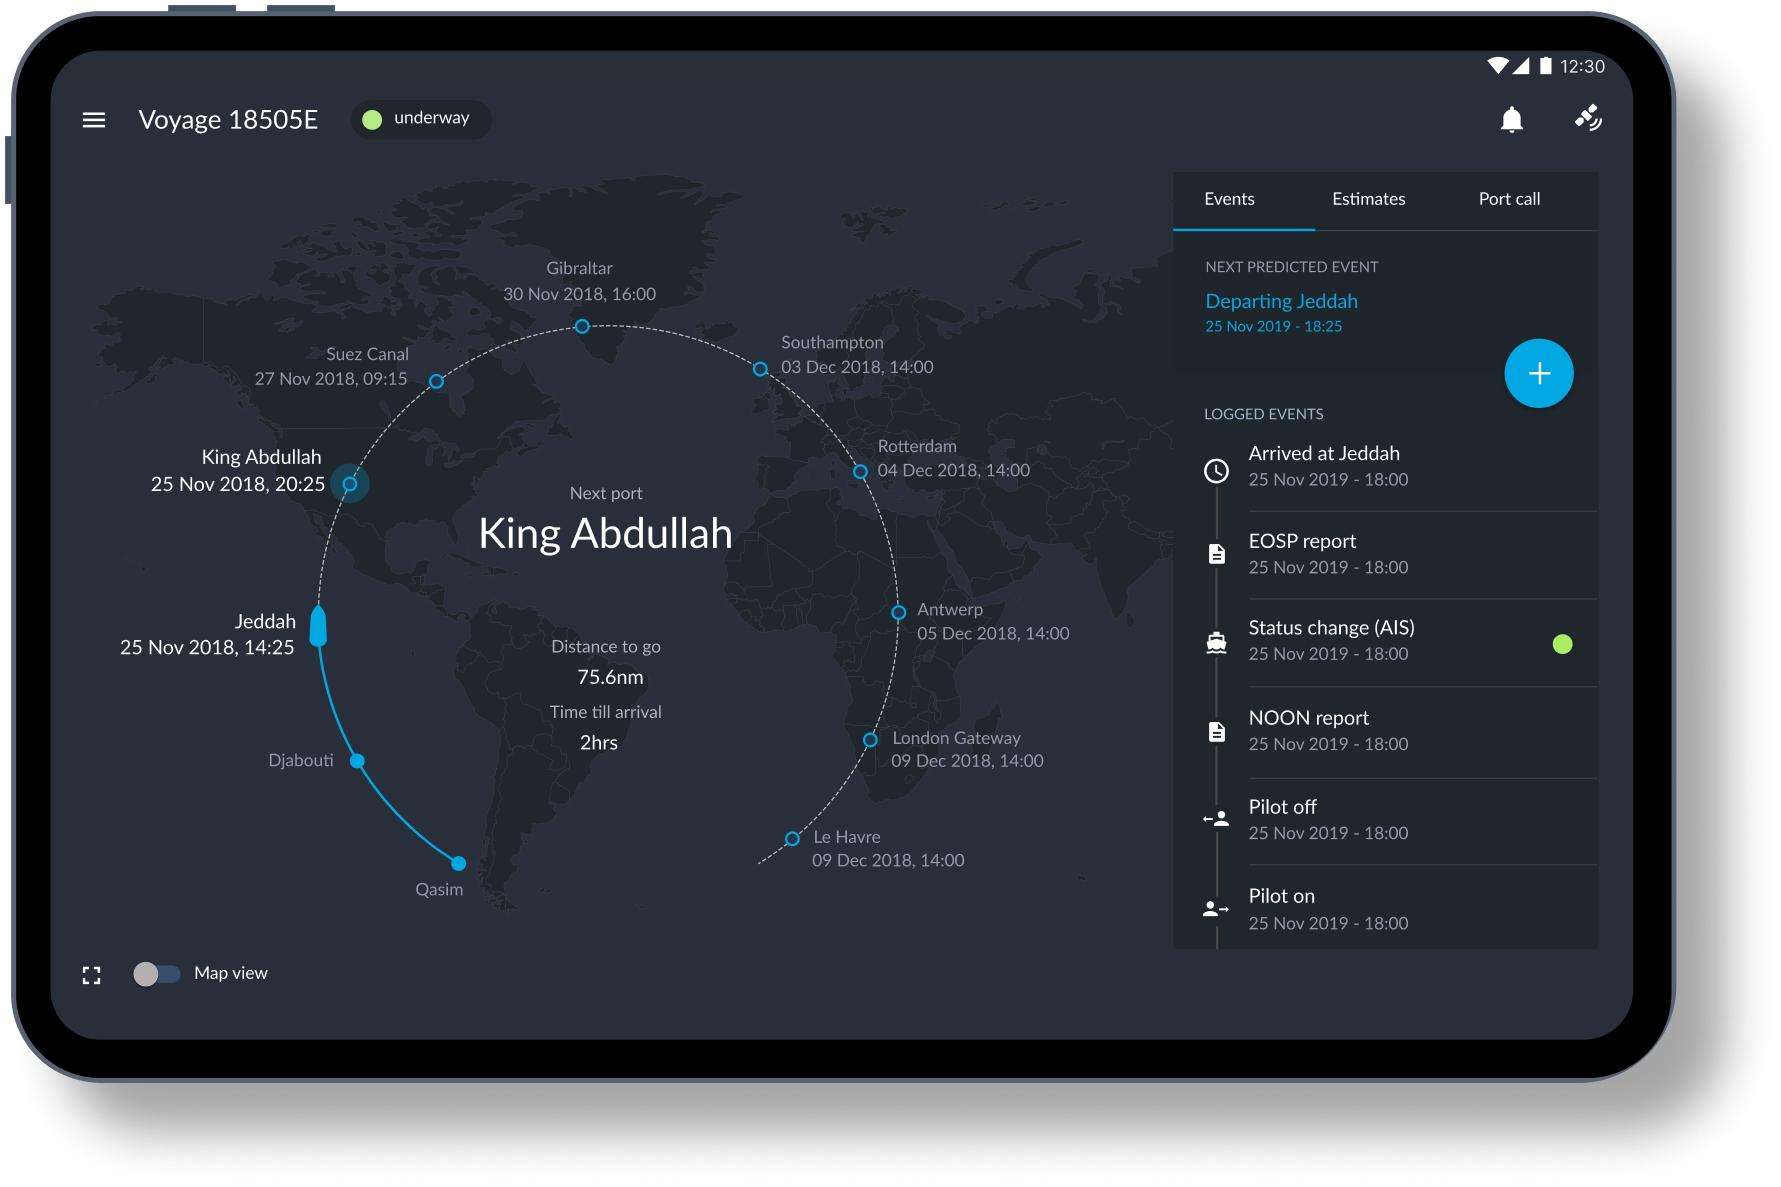
Noon reporting didn't turn into something else. It stayed its own product, done properly. What changed was what came next: the platform visualisation built from that research showed us the data we now had access to, and what other tasks it let us digitise.
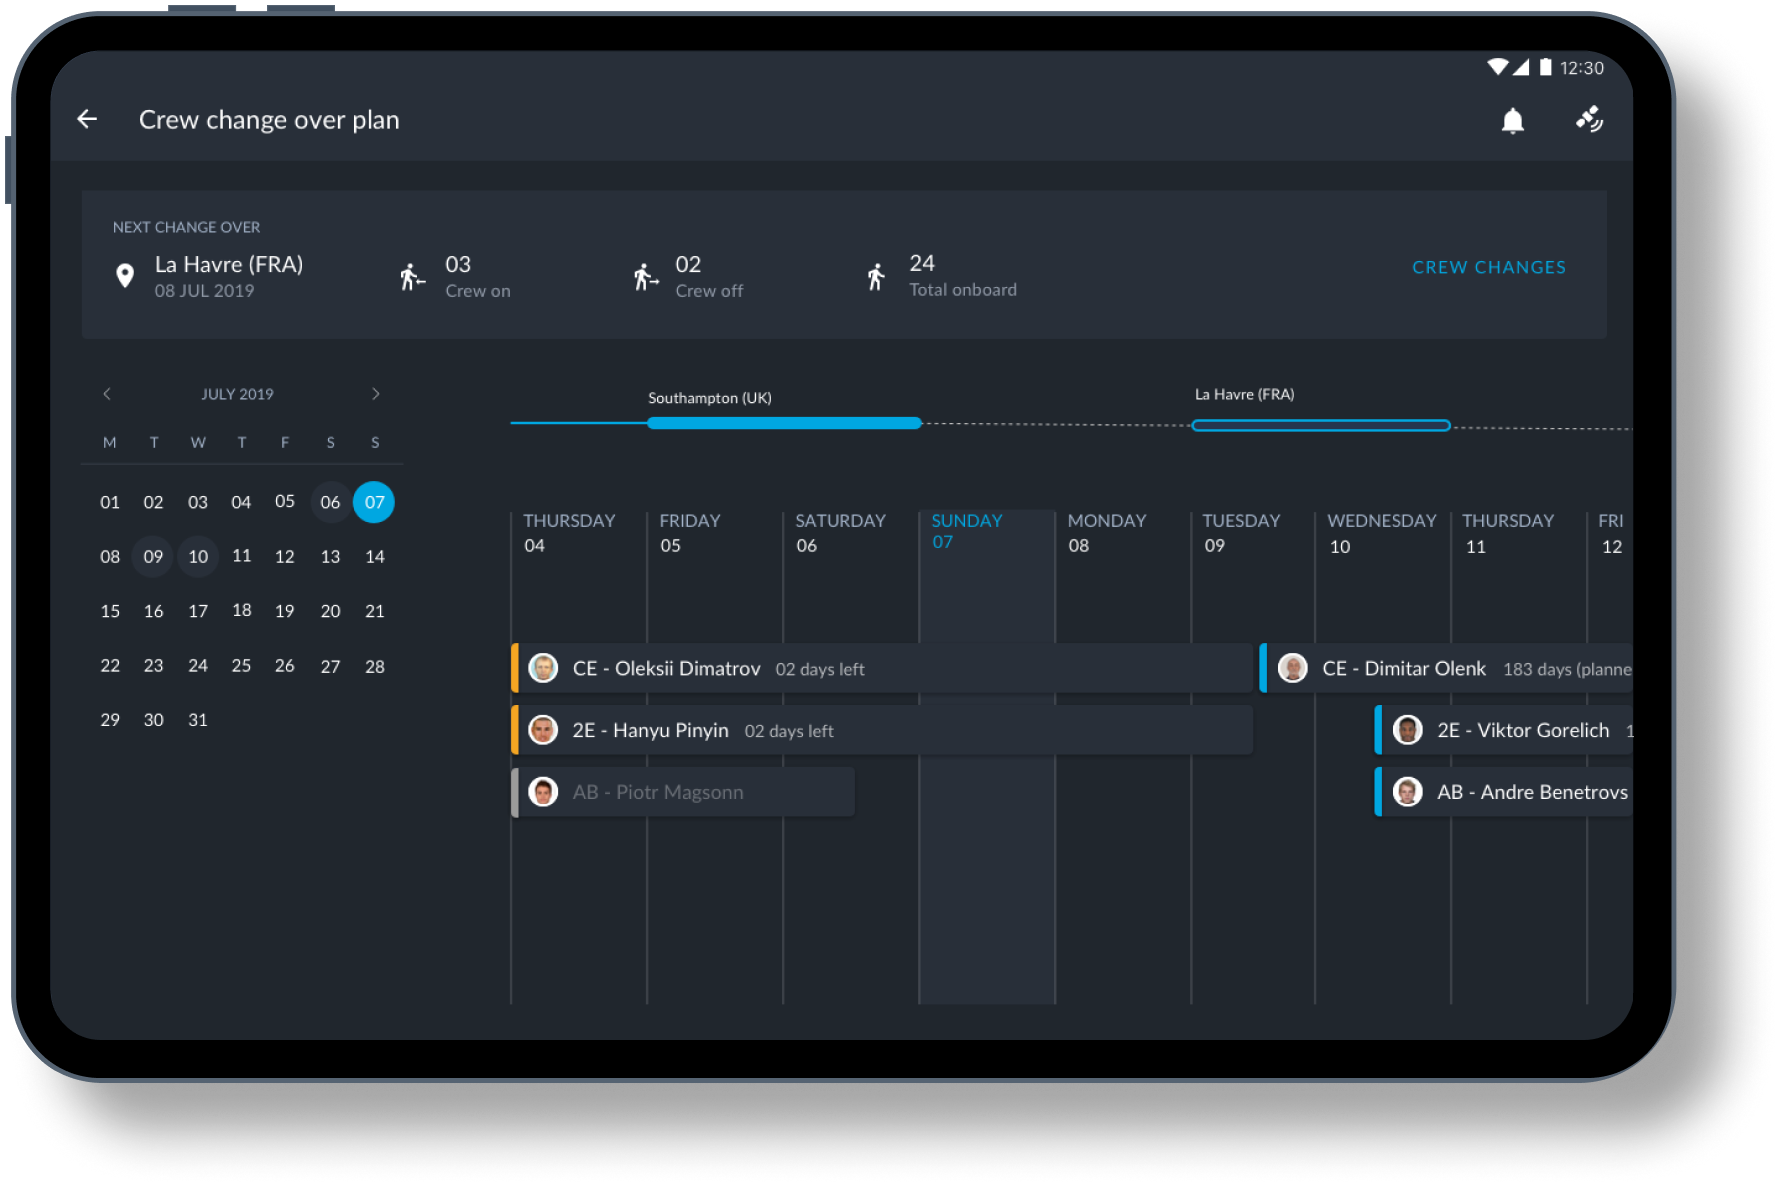
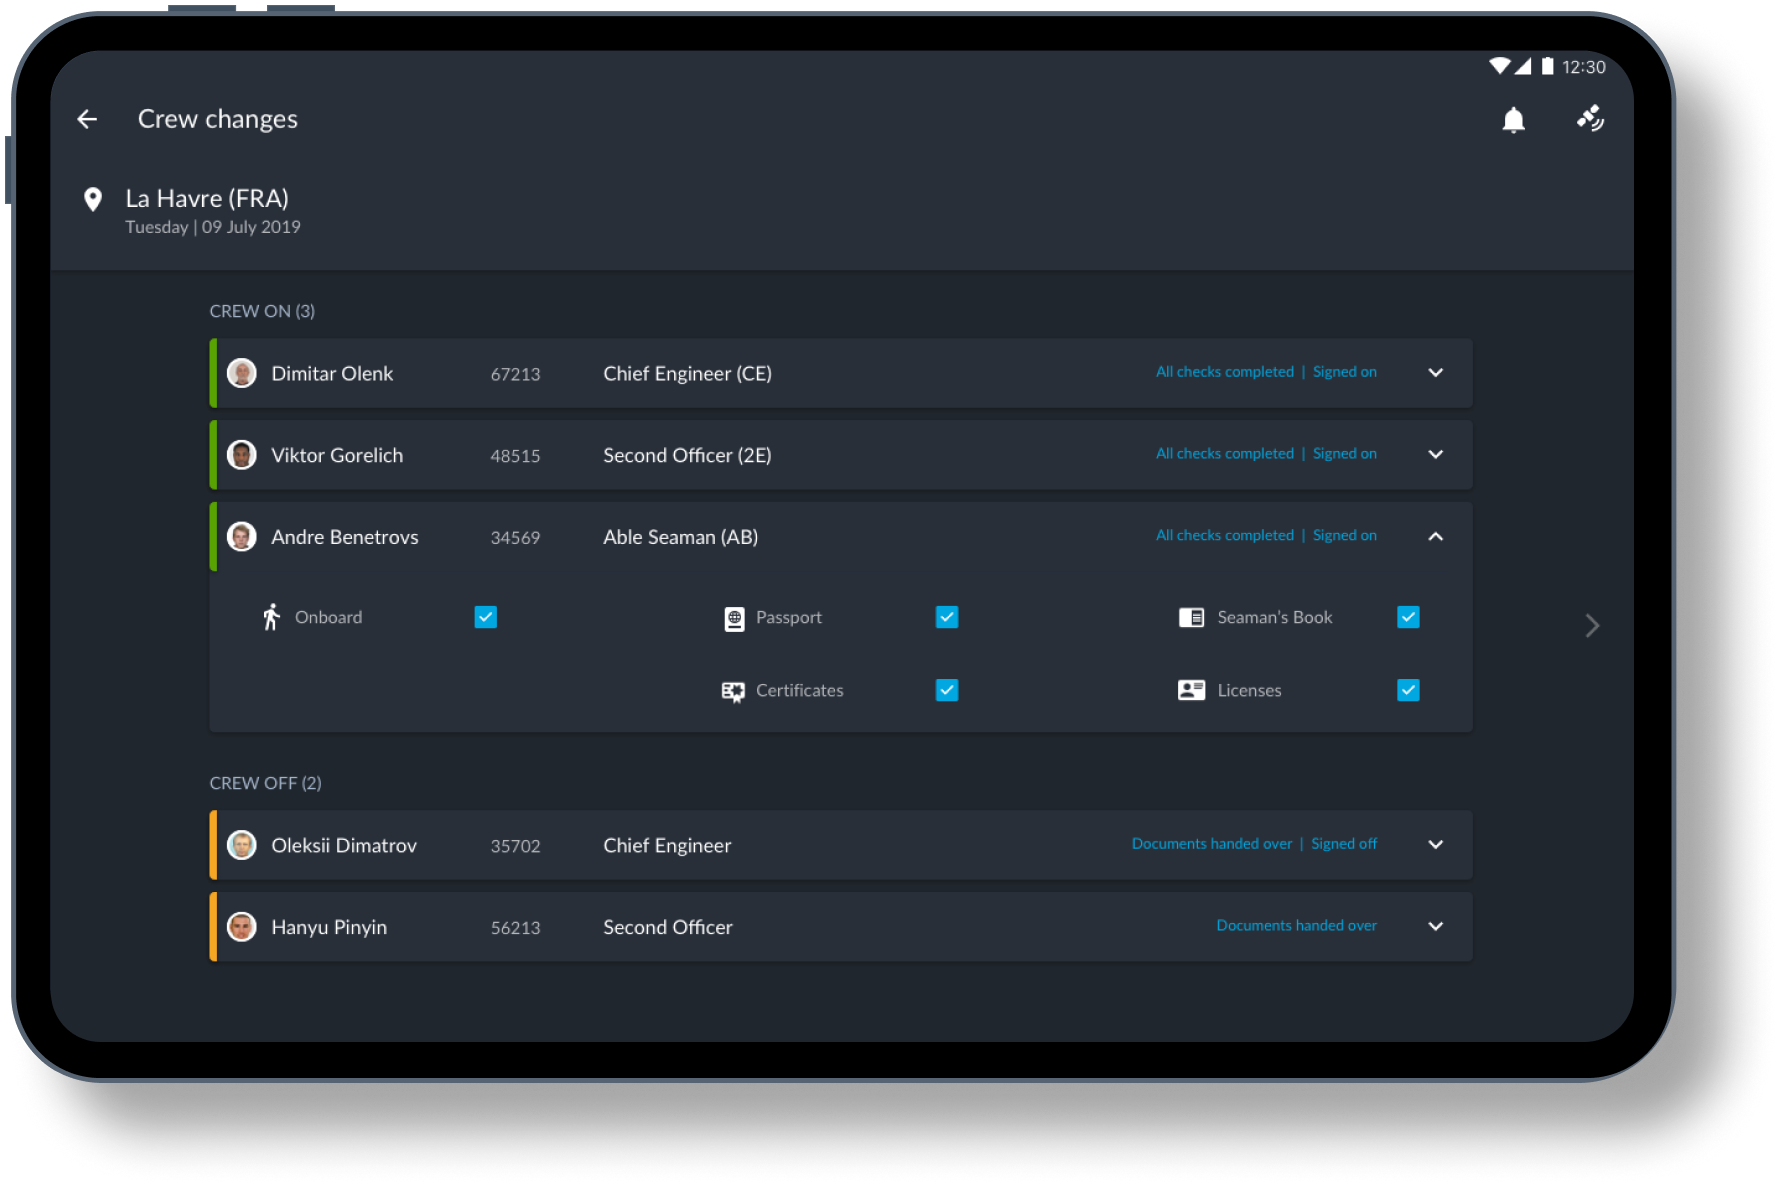
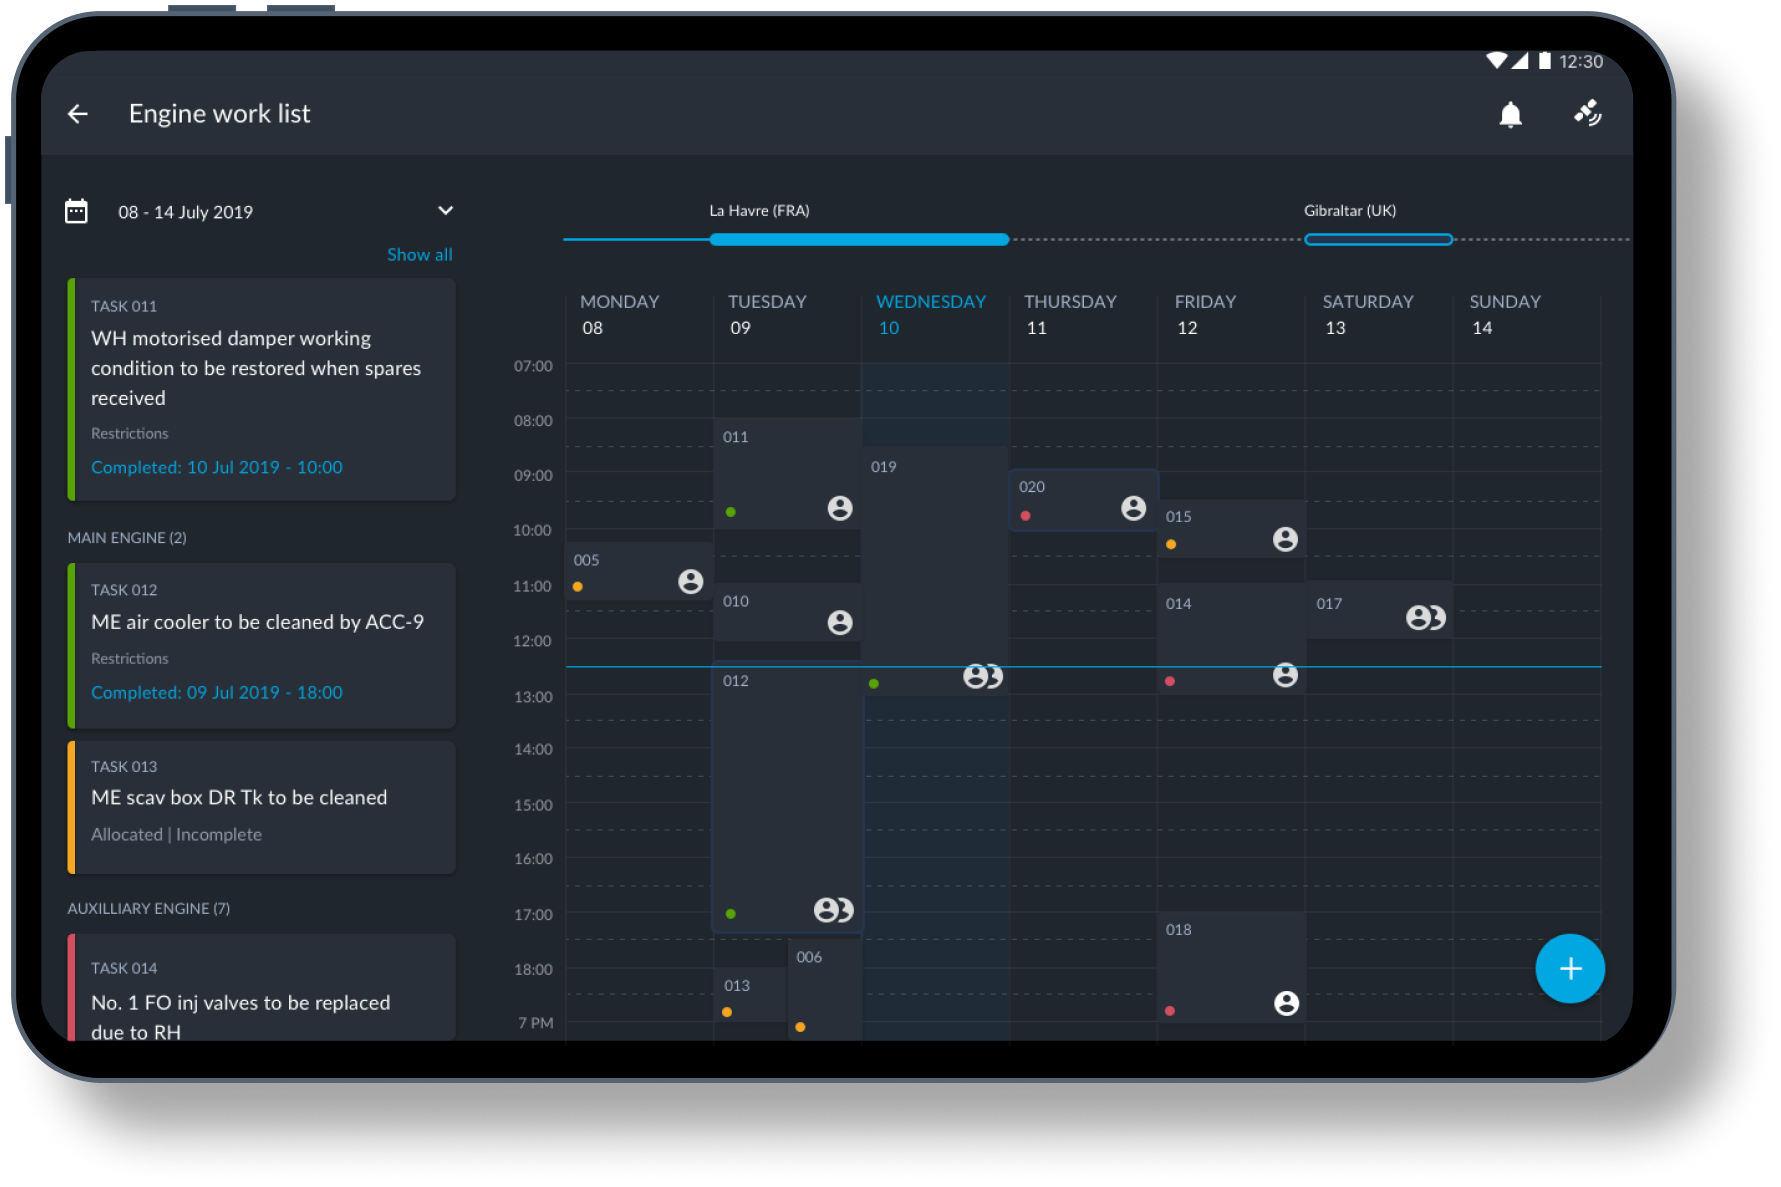
We applied the same level of detail to 36 other workflows, each one built out as its own product: crew sign-on, crew transfers, maintenance worklists, procurement, deliveries and voyage planning among them.
"This is amazing. I did not even think you could do some of the things you are doing here. This is perfect."
Deck Officer - onboard user, 90POE
What I learned
Transformation work starts with empathy, not software.
The hardest part was never the interface. It was earning enough trust from the crew to see how they actually worked, and enough patience from the business to let that research shape the roadmap.
Being onboard mattered more than any workshop. Watching a fifteen-hour noon report happen taught me things no stakeholder briefing could, and gave me the evidence to hold my ground when priorities were contested.
Every stakeholder had a legitimate claim on the platform. Shore-side teams wanted their data, Engineering had legacy constraints, leadership needed a fundable roadmap, and crews needed something that respected how they worked. Reconciling those without losing the thing that made it valuable was the real job.
Transformation is understanding people well enough to change how they work, without ever making them feel replaced.